
September 30, 2011
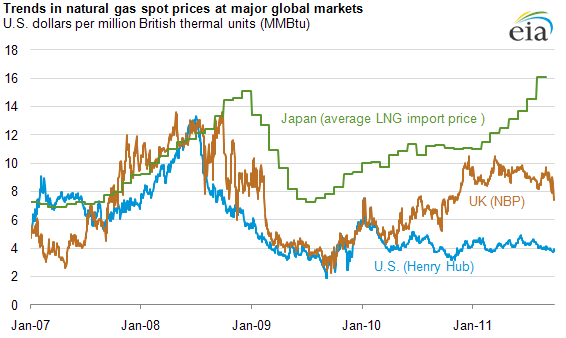
Global natural gas prices vary considerably
Source: U.S. Energy Information Administration, based on Bloomberg, L.P.
Note: Average Japanese LNG prices available only monthly, latest figures are for August.
Note: Average Japanese LNG prices available only monthly, latest figures are for August.
Global natural gas prices vary considerably from one region to another. Since the beginning of 2010, North American prices have been relatively low, Asian prices relatively high, and northwest European prices in between.
- North American natural gas markets are highly competitive, with many buyers and sellers. They have seen considerable production growth in recent years; according to EIA, U.S. dry natural gas production rose 20% between 2005 and 2010. Henry Hub spot prices are the reference prices for North America and have averaged about $4.17 per million British thermal units since January 2009. Prices at Henry Hub have been modest by global standards since the financial crisis of 2008-09.
- Northwestern Europe has also developed strong spot markets, starting in the United Kingdom and now in Belgium, the Netherlands, and Germany. Spot prices at the United Kingdom's National Balancing Point (NBP) generally track other northwestern European pricing points. Spot prices in northwest Europe reflect a limited number of suppliers and a relative dearth of local production. Key suppliers (Russia and Qatar) supply much of their gas under long-term contracts not directly reflected in the spot market, and gas deliveries from Norway can vary.
- The situation in Japan is similar to that in many Asian countries, where there is only a limited spot market. Prevailing prices reported in the graph are averages of all supplies and largely reflect long-term contracts that price natural gas in terms of a linkage to crude oil. Japanese natural gas prices had been rising over the past year, even before the earthquake.
The relationship between North American and northwest European spot prices appears to have changed in the last 18 months. Before that time, they often followed similar paths; differences often reflected local conditions, such as storage, and tended to be temporary. However, in 2010 and 2011, the differences have grown and appear to be more lasting.