Many states have adopted policies to encourage energy efficiency
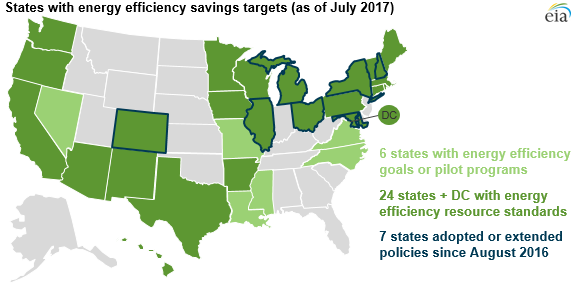
As of July 2017, thirty states and the District of Columbia have adopted energy efficiency policies—either mandated requirements, voluntary goals, or pilot programs—designed to lower the growth of electricity consumption by using electricity more efficiently. Seven of these states have either created new or updated existing energy efficiency standards within the past year.
Since Texas became the first state with an energy efficiency resource standard (EERS) in 1999, 24 states have adopted an EERS. Four states have set voluntary goals, and two states established energy efficiency pilot programs. An EERS uses either financial incentives or non-performance penalties to encourage energy efficiency and reduce electricity sales. Typically, EERS targets increase over time.
Efficiency targets may be set as reductions from retail electricity sales in a base year or the average of prior years, as a cumulative reduction over a compliance period, or as a percent of a long-term forecasted consumption amount. An EERS may specify reductions for energy use, peak electricity demand, or both. Some newer policies include traditional customer-incentive programs such as lighting or cooling equipment rebates as well as utility-sponsored measures that make the electricity distribution system more efficient.
In many ways, EERS are similar to renewable portfolio standards (RPS), which encourage the adoption of certain renewable energy technologies. Like RPS, EERS often differ in stringency and timing across states. Six states—Colorado, Illinois, Maryland, Michigan, New York, and Ohio—that initially created an EERS in 2007 or 2008 have since extended expiring targets beyond 2020. Each state’s targeted electricity savings is different, ranging from 1.0% of prior year sales (in Michigan) to 2.1% of average sales over the prior three years (in Illinois). Among these states, the final year of the standards ranges from 2020 to 2030.
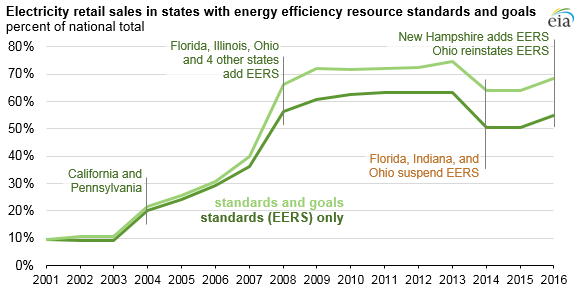
In 2014, Florida, Indiana, and Ohio eliminated or suspended existing EERS policies. In August 2016, New Hampshire became the latest state to adopt an EERS, with a cumulative savings target of 3.1% of 2014 delivered electricity by 2020. In December, Ohio reinstated its EERS.
Retail electricity sales in the states that have efficiency mandates accounted for 55% of total U.S. retail electricity sales in 2016. This percentage represents the upper bound of electricity sales directly affected by EERS. In 11 states, the EERS policy covers all retail electricity sales in the state, while in others the EERS includes a subset of the state’s electricity sales; for instance, only sales by investor-owned utilities (IOUs) or a combination of IOUs, municipals, and co-ops (cooperative electric utilities).
Taking into account the electricity sales that are not directly affected, EERS-covered electricity retail sales in 2016 were close to 45% of total U.S. retail electricity sales, based on EIA sales data and information from the American Council for an Energy-Efficient Economy (ACEEE).
Principal contributor: Carol Brotman White
Tags: consumption/demand, electricity, energy efficiency, map, policy