Energy commodity prices declined more than other commodities in the first half of 2017
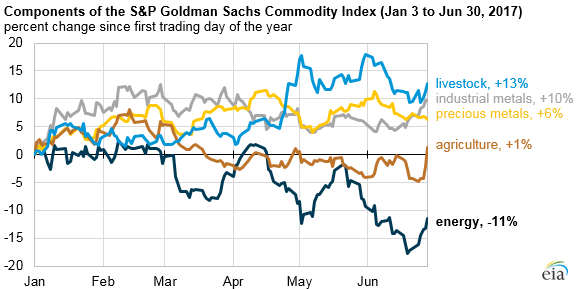
The energy component of the Standard and Poor’s Goldman Sachs Commodity Index (GSCI) fell 11% during the first half of 2017, the largest decline for any commodity group in the index. Other components of the index—livestock, industrial metals, precious metals, and agriculture—had end-of-June prices that were higher than at the beginning of the year. Supply-side developments unique to energy commodities likely contributed to the divergence.
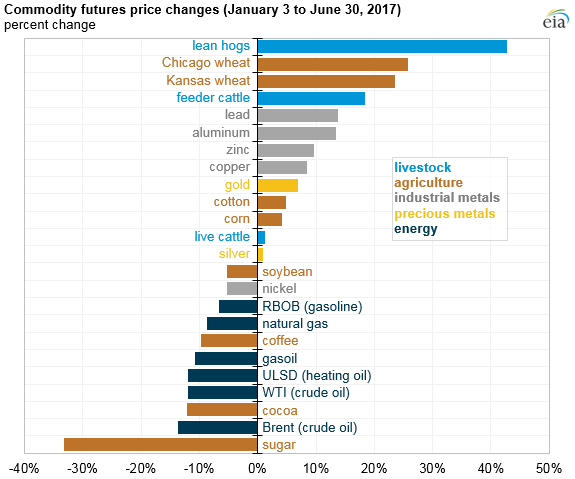
Note: RBOB is reformulated gasoline blendstock for oxygenate blending. ULSD is ultra-low sulfur diesel. WTI is West Texas Intermediate.
Because two major crude oil price benchmarks, West Texas Intermediate (WTI) and Brent, account for 70% of the weighting in the S&P GSCI energy index, the energy index tends to follow major price movements in the crude oil market. During the first half of 2017, WTI crude oil prices declined by 12%, while Brent prices fell 14%.
Oil production cuts agreed to among several countries within and outside the Organization of the Petroleum Exporting Countries (OPEC) at the end of 2016 were generally complied with over the first six months of 2017, but the drop in production did not significantly reduce global liquid fuels inventories. The cuts have been partially offset by production gains in certain OPEC countries not subject to restrictions, as well as production growth in Brazil and the United States. Recently, the production cut agreement was extended through March 2018.
Petroleum-based products such as reformulated gasoline blendstock for oxygenate blending (RBOB), ultra-low sulfur diesel (ULSD), and gasoil make up 24% of the S&P GSCI energy index. RBOB, essentially the petroleum-based component of motor gasoline, declined the least among petroleum products in the S&P GSCI energy index year to date, declining 7% through June 30. Gasoline prices exhibit seasonality and typically increase ahead of the summer driving season, which likely contributed to less of a decline in prices compared with crude oil and other petroleum products.
Natural gas accounts for the remaining 6% of the S&P GSCI energy index. Natural gas prices declined the least among energy commodities, albeit with significant volatility throughout the first six months. Prices declined as much as 23% from the beginning of the year through mid-February ($3.33 per million British thermal units (MMBtu) to $2.56/MMBtu) because of a relatively warm winter in the United States. Natural gas prices then increased to $3.42/MMBtu in mid-May before falling to about $3.00/MMBtu by the end of June. Natural gas prices have largely been affected by increasing U.S. natural gas exports and relatively flat natural gas production.
Other commodities in the S&P GSCI index had mixed returns in the first half of the year. Only sugar had a greater price decline than Brent crude oil, falling by 33% since the beginning of the year. Half of the agricultural commodities are down through June, and nickel is the only industrial metal with negative returns through June 30. Lean hogs, part of the livestock commodity group, experienced the largest price increase, rising 43%.
Principal contributor: Jeff Barron
Tags: crude oil, liquid fuels, oil/petroleum, prices