U.S. exports of crude oil and petroleum products have more than doubled since 2010
Updated June 27 at 11:00 a.m. to correct units in several charts.
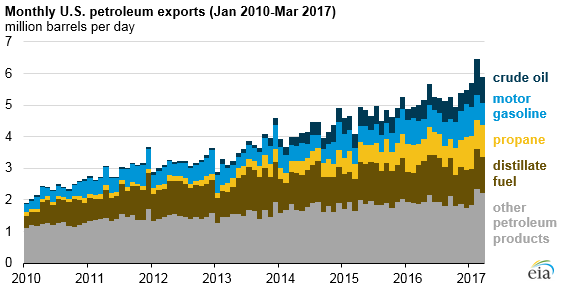
U.S. crude oil and petroleum product gross exports have more than doubled over the past six years, increasing from 2.4 million barrels per day (b/d) in 2010 to 5.2 million b/d in 2016. Exports of distillate, gasoline, propane, and crude oil have all increased, but at different paces and for different reasons.
Restrictions on exporting domestically produced crude oil were lifted in December 2015, and in 2016, the United States exported an average of 520,000 b/d. U.S. crude oil exports reached 1.1 million b/d in February 2017, the highest monthly level on record. While Canada remains the largest destination for U.S. crude oil exports, Canada’s share of total U.S. crude oil exports has declined, dropping from 92% in 2015 (427,000 b/d) to 58% in 2016 (301,000 b/d). Other leading destinations for U.S. crude oil exports in 2016 included the Netherlands, Curacao, China, Italy, and the United Kingdom.
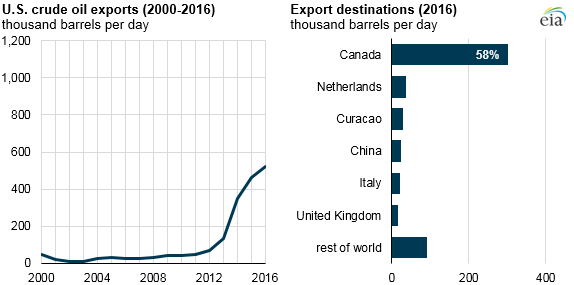
Beyond the lifting of crude oil export restrictions, other factors such as favorable price differentials, lower shipping costs, and rising domestic production have increased U.S. crude oil exports. U.S. production fell through the first nine months of 2016, but increased at the end of 2016 and has continued to increase through the first five months of 2017. U.S. crude oil exports in 2016 were 55,000 b/d greater than exports in 2015—a slower rate of growth compared with year-over-year changes in 2015 and 2014.
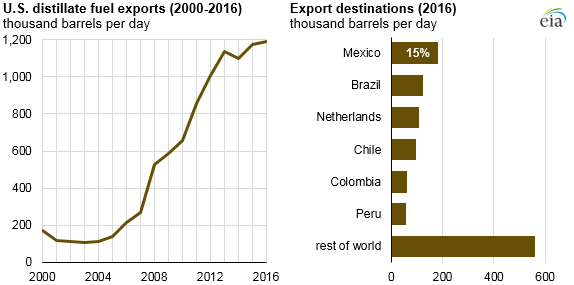
U.S. exports of distillate also experienced slower year-over-year growth compared with recent years. In 2016, the United States exported 1.2 million b/d of distillate, the country’s largest petroleum product export. Between 2010 and 2016, U.S. exports of distillate grew by 81% (534,000 b/d), but most of this growth occurred between 2011 and 2013. The largest destination for U.S. distillate exports in 2016 was Mexico, averaging 182,000 b/d, followed by Brazil (125,000 b/d) and the Netherlands (108,000 b/d).
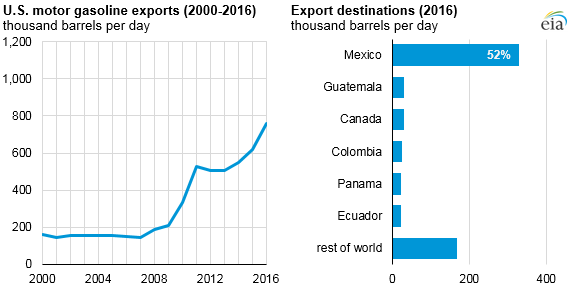
U.S. exports of total motor gasoline have more than doubled since 2010, growing from 335,000 b/d in 2010 to 761,000 b/d in 2016. The growth in gasoline exports took place while domestic consumption, as measured by product supplied, was also increasing. Mexico is the top destination for U.S. motor gasoline exports, and the volume of gasoline trade is significant to U.S. refineries. Over the past five years, U.S. exports to Mexico accounted for between 44% and 53% of total U.S. gasoline exports.
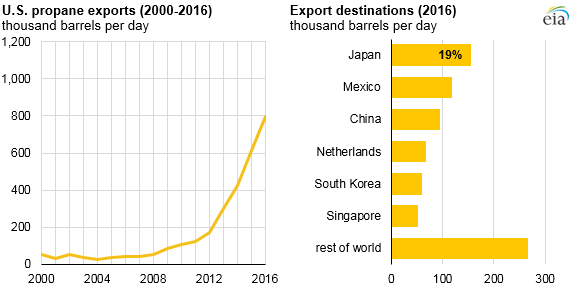
Unlike the recently slowing increases in U.S. exports of crude oil, distillate fuel, and motor gasoline, propane export growth has accelerated. Propane exports are shipped to different destinations than other U.S. petroleum exports. Most other U.S. petroleum exports stay in the Western Hemisphere, but some of the top destinations for U.S. propane exports are Asian countries such as Japan and China. Propane has many non-transportation sector end uses, including as a fuel for heaters and cookstoves and as a feedstock for petrochemical industry.
Principal contributors: Hannah Breul, Mason Hamilton