Natural gas has displaced coal in the Northeast’s generation mix over the past 10 years
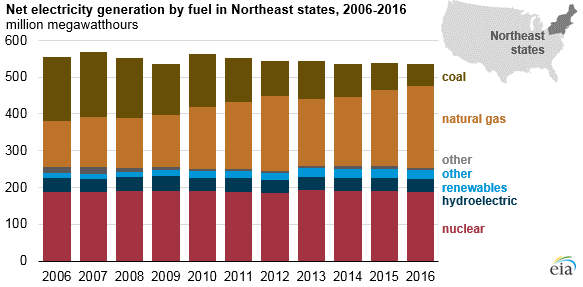
The generation fuel mix of electricity in the Northeast Census division of the United States has shifted dramatically over the past 10 years. In the nine Northeast states, natural gas nearly doubled its share of the region’s total generation to 41% in 2016, up from 23% in 2006. Coal-fired generation fell from 31% to 11% of generation over the same period. Nuclear-powered generation as a share of total generation remained relatively constant near 34%. Despite more than doubling over the same period, the share of nonhydro renewables remains relatively small. Overall, total generation in the region declined by 3% between 2006 and 2016.
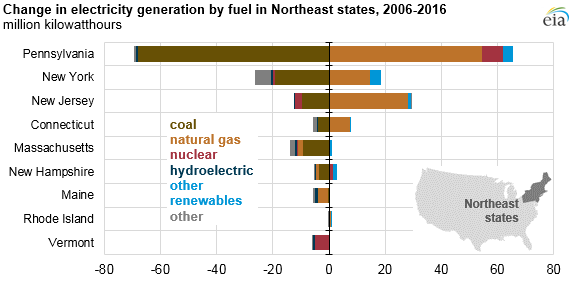
Increased access to low-cost natural gas from the Marcellus Shale and other regional shale plays has driven the switch away from coal in the Northeast United States. Environmental policies at the federal and regional level, such as production tax credits, the Regional Greenhouse Gas Initiative, and renewable portfolio standards, have also contributed to the decline in coal generation. Pennsylvania continues to be a leading coal generator nationally, despite falling by 31%, or 68 million kilowatthours (kWh), between 2006 and 2016. Coal-fired generation in both New York and Connecticut fell by 90% between 2006 and 2016, or by 19 million kWh and 4.1 million kWh, respectively.
Nuclear generators accounted for 33.9% of Northeast generation in 2006 and 34.98% in 2016. Although no new nuclear plants were constructed in the Northeast during this period, one plant, Vermont Yankee, ceased operations in December 2014. Vermont Yankee alone accounted for 72% of total generation in Vermont in 2006. In addition, several nuclear plants in the Northeast region received approvals for uprates that increased their capacities—some increasing by as much as 15%. Other differences in nuclear output in 2006 and 2016 are likely attributable to the timing of maintenance and refueling cycles.
Hydropower accounted for 7% of Northeast generation in both 2006 and 2016. Nonhydro renewable generation was a relatively small portion of the overall generation mix in 2016 at 5%, but it had the largest percentage growth rate over the past decade. States such as New Hampshire, New York, Pennsylvania, and New Jersey more than doubled their nonhydro renewable generation between 2006 and 2016.
Electricity generation growth from nonhydro renewables came primarily from wind and solar; 93% of the wind plants and all of the utility-scale solar plants currently operating in the region have been installed since 2006. The 30 megawatt Block Island Wind Farm, the first offshore wind project in the United States, began operation in 2016. As of 2016, 2.1 gigawatts of utility-scale solar capacity (plants with at least 1 megawatt of capacity) had been installed in the Northeast region.
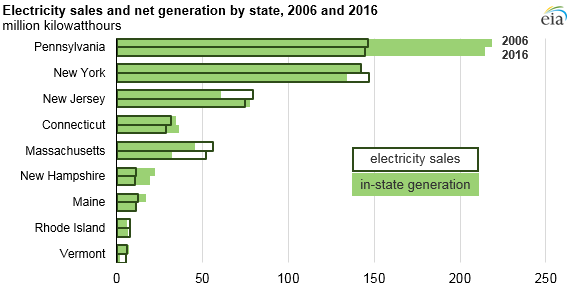
Much like the rest of the United States, overall electricity use in the Northeast was relatively constant between 2006 and 2016. Over that period, electricity sales fell by 2% in the Northeast while national sales fell by 1%. Generation in the Northeast fell by 3% over the same period. With the exception of New Jersey, Connecticut, and New Hampshire, which had increases in generation ranging from 5% to 28%, most Northeast states generated less electricity in 2016 than in 2006. New Jersey nearly tripled its natural gas-fired generation between 2006 and 2016, and solar generation grew to 1 million kWh of solar in 2016. Pennsylvania remains the region’s largest net exporter of electricity, despite exports dropping from 73 million kWh in 2006 to 70 million kWh in 2016.
Principal contributor: Richard Bowers
Tags: coal, electricity, generation, natural gas, Northeast