Permian Basin oil production and resource assessments continue to increase
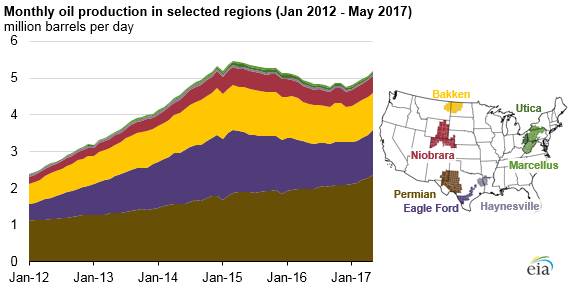
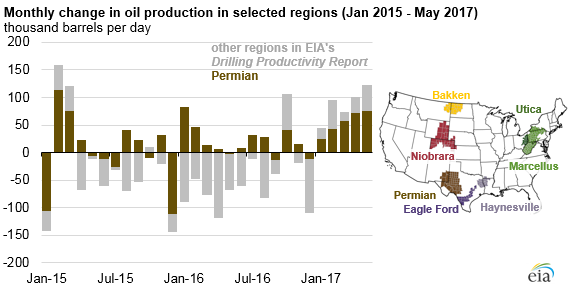
Crude oil production in the Permian Basin is expected to increase to an estimated 2.4 million barrels per day (b/d) in May, based on estimates from EIA’s Drilling Productivity Report. Between January 2016 and March 2017, oil production in the Permian Basin increased in all but three months, even as domestic crude oil prices fell. As production in other regions fell throughout most of 2015 and 2016, the Permian provided a growing share of U.S. crude oil production.
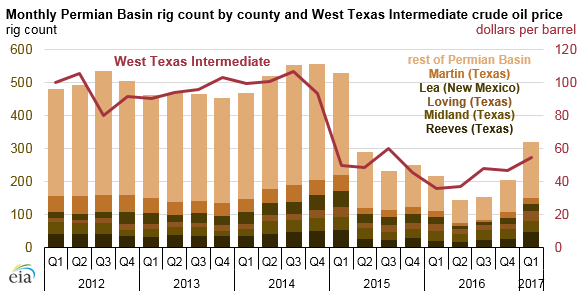
With rising oil prices over the past year, the Permian continues to be attractive to drillers, as reflected in rising rig counts. As of April 21, 2017, the number of rigs in the Permian Basin reached 340, or 40% of the 857 total oil- and natural gas-directed rigs operating in the United States. The Permian rig count reached as high as 568 in late 2014 before falling to a low of 134 in spring 2016.
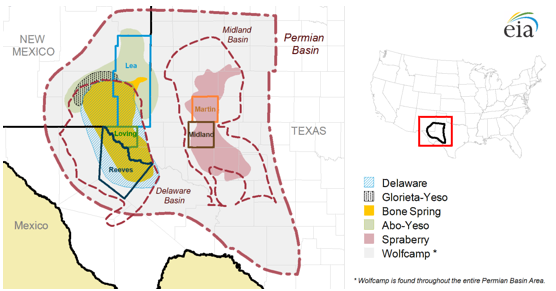
The land area over the Permian Basin covers more than 75,000 square miles in 43 counties of western Texas and southeastern New Mexico. However, more than half of the rigs that have been added in the Permian are concentrated in just five counties: Reeves, Loving, Midland, and Martin counties in Texas and Lea County in New Mexico. Oil production from these five counties averaged 882,000 b/d as of November 2016 and accounted for approximately 42% of total Permian Basin oil production (2.1 million b/d) in that month. As more rigs continue to be moved to these counties, production from these areas is expected to continue to increase, which will drive the increases in total Permian production.
Recent geological surveys have further explored the resources contained in the Permian Basin. In November 2016, the U.S. Geological Survey (USGS) estimated that technically recoverable tight oil and shale gas resources in the Midland Basin portion of Texas’ Permian Basin (specifically the Wolfcamp shale formation) could exceed 20 billion barrels of oil, 16 trillion cubic feet of natural gas, and 1.6 billion barrels of hydrocarbon gas liquids. The technically recoverable resource estimate for tight oil in the Midland is higher than any previous USGS assessment of tight oil resources in any domestic resource basin.
More information about the Permian Basin and other major production regions in the United States is available in EIA’s Drilling Productivity Report.
Principal contributors: Faouzi Aloulou, Jesse Esparza, and Naser Ameen
Tags: drilling, liquid fuels, map, oil/petroleum, Permian, production/supply, states