
Maryland increases renewable portfolio standard target to 25% by 2020
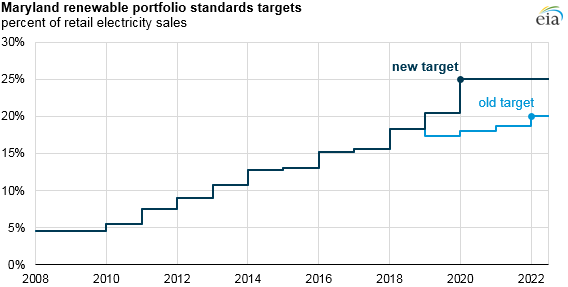
This February, Maryland increased the renewables generation target in its renewable portfolio standard (RPS) to 25% of retail electricity sales by 2020, replacing the earlier target of 20% by 2022. The change occurred as legislators in both houses of the state’s General Assembly voted to override the governor’s veto of legislation they had first passed in 2016.
The Maryland RPS is divided into two tiers. Tier one includes electricity generated from solar, wind, biomass, geothermal, fuel cells, ocean, small hydro, as well as some qualified waste technologies. Tier one also includes two technology specific targets (or set-asides). The solar generation set-aside, which was included in the state’s previous RPS, now ramps up to 2.5% of sales by 2020. The set-aside for offshore wind has not been determined yet, but will be set by the Maryland Public Service Commission starting in 2017 and will be no more than 2.5% of sales. Hydroelectric generation can be used to meet tier two requirements, which are currently set at 2.5% of sales, but this tier expires in 2018.
In 2015, Maryland’s RPS target was 10.5% of electricity sales, which equaled 8.0 million renewable energy credits (RECs). RECs are tradeable certificates representing generation of one megawatthour from eligible renewable electricity sources, which for Maryland includes generation within the PJM region, which covers several areas across Mid-Atlantic, Southern, and Midwestern states. From 2008 to 2015, Maryland’s renewable generation requirements have grown from 2.7 million RECs to 8.0 million RECs. Over that same time period, the compliance cost for the RPS has increased from a total of $3.26 million to $127 million.
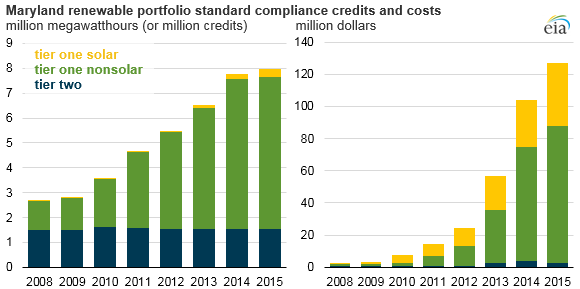
Solar technologies have made up a small part of the RECs used for compliance, but a relatively larger share of the cost of compliance. Of the RECs used for compliance in 2015, only 4% were from solar. In comparison, solar made up 31% of the cost of compliance. During 2015, the average cost for solar RECs in Maryland was $130 per REC, nearly 10 times the cost of tier one, nonsolar RECs. However, with an increase in the number of solar facilities in the state, solar REC costs have declined from as high as $345 per REC in 2008. Conversely, tier one, nonsolar REC prices have increased from just under $1 per REC in 2008 to almost $14 per REC in 2015.
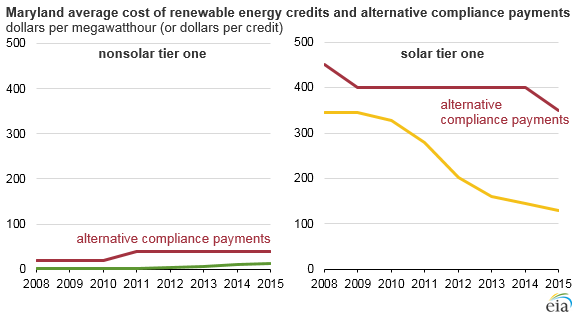
Under Maryland’s RPS , electric service providers can choose to make alternative compliance payments (ACPs) in lieu of purchasing RECs. ACPs, which are set by Maryland’s Public Service Commission, are often viewed as a ceiling for REC prices. If a market lacks sufficient supply to meet RPS requirements, the average price of a REC would be at or near its ACP. In 2015, the ACP was $40 for tier one nonsolar RECs and $350 for solar RECs. ACPs made up only 0.02% of the total cost of compliance in 2015.
Principal contributor: Cara Marcy