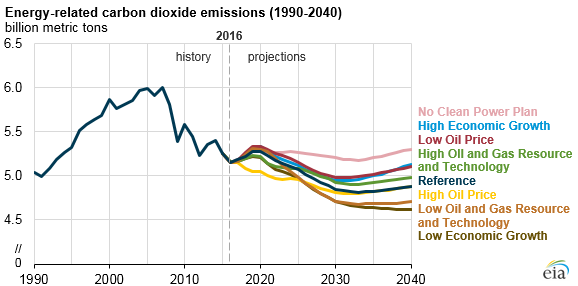
Projected carbon dioxide emissions are sensitive to factors driving fossil fuel use
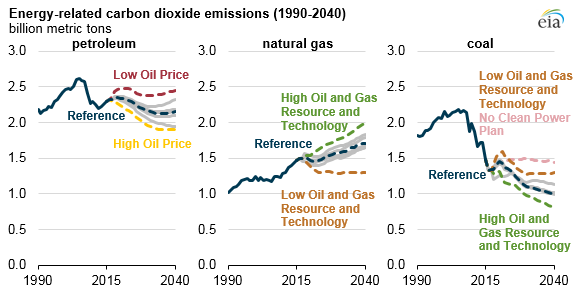
The U.S. Energy Information Administration’s Annual Energy Outlook 2017, released in January, explores several factors affecting projected fossil fuel use and the resulting level of energy-related CO2 emissions over the coming decades.
Projected consumption of petroleum and other liquid fuels is heavily influenced by fuel economy standards for light-duty vehicles and for medium- and heavy-duty trucks. Across the modeling cases that keep existing laws and policies constant, projected use of these fuels varies depending on world oil prices that directly affect the prices of gasoline and distillate fuel oil and on production and disposition of hydrocarbon gas liquids. Hydrocarbon gas liquids are classified as petroleum products but are primarily produced at plants that process liquids-rich wet natural gas rather than at crude oil refineries.
Natural gas consumption is sensitive to natural gas prices, which are affected by the development of U.S. natural gas resources. Consumption is also affected by regulations and incentives related to fuels and technologies that compete with electricity generation fueled by natural gas. Efficiency standards for buildings, furnaces, and other appliances also influence the demand for both natural gas and electricity. Coal consumption largely depends on the power sector regulatory environment and competition from other electricity-generating fuels such as natural gas and renewables.
With the exception of one case that assumes the Clean Power Plan is not implemented, all AEO2017 cases reflect current laws and final regulations in effect as of mid-October 2016. In recent years, EIA has alternated between heavy and light versions of the AEO, with the heavy version incorporating additional cases and Issues in Focus articles that are not provided in the light version.
AEO2016 included cases that explored the implications of extended policies in the form of continuing rounds of more stringent regulations under existing laws or the continuation of tax credits currently scheduled to expire. These cases show how changes in laws and regulations affect projected fossil fuel use and related CO2 emissions. Similarly, the No Clean Power Plan cases in both AEO2016 and AEO2017 show how projected fuel use and emissions might be affected if the Clean Power Plan is not implemented.
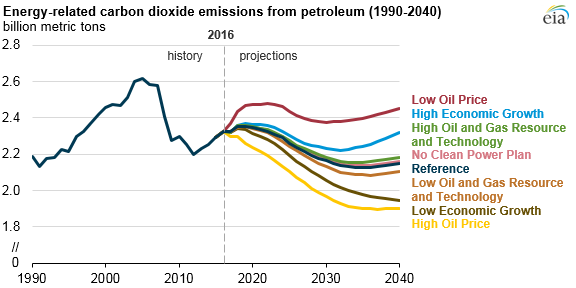
Petroleum and other liquids are used in the United States primarily for transportation. Two cases in AEO2017 that consider a wide range of world oil prices produce the greatest range in CO2 emissions from petroleum liquids. Petroleum-related CO2 emissions totaled 2,325 million metric tons (MMmt) in 2016. In the Low Oil Price case, these emissions increase to 2,454 MMmt of CO2 by 2040, and in the High Oil Price case these emissions fall to 1,901 MMmt by 2040.
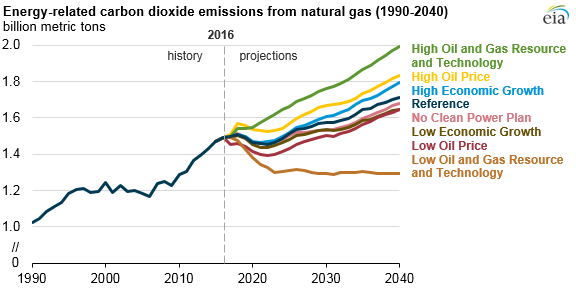
Natural gas use and emissions show significant sensitivity to the different assumptions in the Oil and Gas Resource and Technology cases in AEO2017. In the High Oil and Gas Resource and Technology case, higher natural gas resources and more optimistic assumptions for drilling technologies result in more natural gas production and lower natural gas prices. Lower prices result in more natural gas consumption in every sector, especially the electric power sector.
In the High Oil and Gas Resource and Technology case, emissions of CO2 from natural gas use rise from 1,493 MMmt in 2016 to 1,991 MMmt in 2040. In the AEO2017 Low Oil and Gas Resource and Technology case, which has less optimistic assumptions for resources and technology, these emissions fall to 1,295 MMmt of CO2 by 2040. This is the only scenario in the AEO2017 analysis where natural gas CO2 emissions in 2040 are lower than they were in 2016.
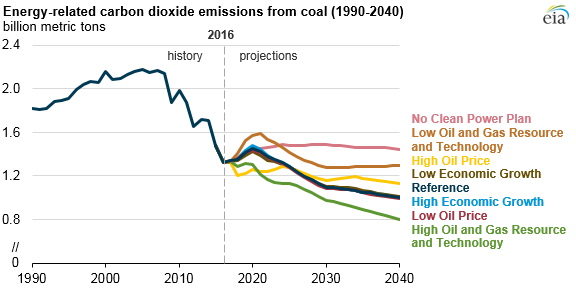
Under Reference case assumptions for natural gas and coal markets, the level of CO2 emissions from coal use is most affected by whether or not the Clean Power Plan is implemented. Across the AEO2017 cases, coal-related CO2 emissions after 2022 are highest in the No Clean Power Plan case, rising to 1,446 MMmt in 2040. Coal-related CO2 emissions are lowest in the High Oil and Gas Resource and Technology case, as low natural gas prices lead to greater use of natural gas for power generation and less use of coal. In this case, coal CO2 emissions fall from 1,483 MMmt in 2016 to 797 MMmt in 2040.
Total energy-related CO2 emissions reflect the effects of economic growth, consumer behavior, energy prices, and government policies at both the federal and state levels. Across the AEO2017 cases, projected total energy-related CO2 emissions are highest in the case that uses Reference case assumptions with the exception that the Clean Power Plan is not implemented. By 2025, energy-related CO2 emissions in this case are 12% below the 2005 level, compared with 15% below the 2005 level in the Reference case with the Clean Power Plan. By 2030, the gap between projected emissions in the two cases widens, with the No Clean Power Plan case showing a 13% reduction from the 2005 level and the Reference case with the Clean Power Plan case showing a 19% reduction from the 2005 level.
The AEO2017 case with the lowest energy-related CO2 emissions changes over the projection period. In 2025, the High Oil Price case has the lowest total energy-related CO2 emissions, at 4,960 MMmt, or 17% below the 2005 level. By 2030, the Low Oil and Gas Resource and Technology case and the Low Economic Growth case both result in emissions that are roughly 21% below the 2005 level. By 2040, the Low Economic Growth case results in the lowest emissions across the AEO2017 cases, at 4,616 MMmt, or 23% below the 2005 level.
Principal contributor: Perry Lindstrom