Power sector carbon dioxide emissions fall below transportation sector emissions
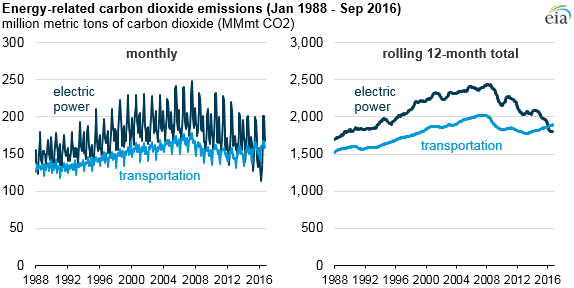
U.S. carbon dioxide (CO2) emissions from the transportation sector reached 1,893 million metric tons (MMmt) from October 2015 through September 2016, exceeding electric power sector CO2 emissions of 1,803 MMmt over the same time period. On a 12-month rolling total basis, electric power sector CO2 emissions are now regularly below transportation sector CO2 emissions for the first time since the late 1970s. CO2 emissions from electric power have been trending lower since 2007.
Comparing emissions over a 12-month period reduces the effects of seasonal fluctuations. Both sectors tend to have higher consumption and emissions in the summer months when electricity demand and vehicle travel are relatively high. Emissions levels through September 2016 represent the latest available data in EIA’s Monthly Energy Review.
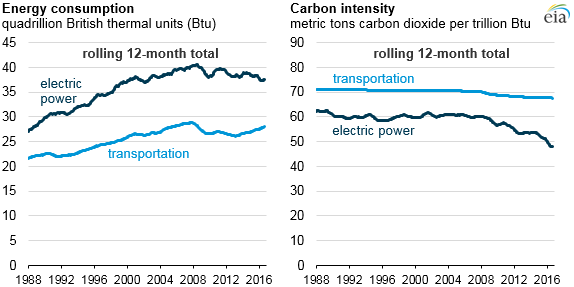
The electric power sector makes up a larger share of total U.S. energy consumption than the transportation sector. However, CO2 emissions from the electric power sector are now lower than those from transportation because the carbon intensity of the power sector has fallen much faster than the carbon intensity of the transportation sector.
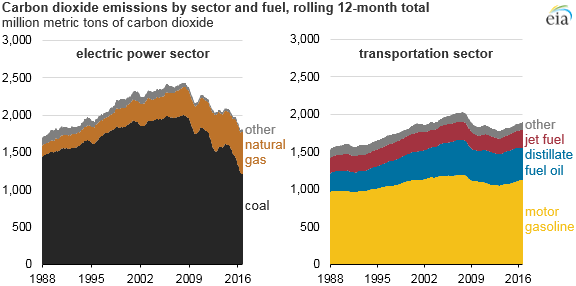
Emissions from the electric power sector are primarily from coal-fired and natural gas-fired electric generators. On average, emissions associated with combusting coal are higher than those associated with combusting natural gas. The average rate of CO2 emitted from combusting coal ranges from 206 to 229 pounds per million British thermal units (lbs CO2/MMBtu), depending on the type of coal consumed. The combustion of natural gas emits on average 117 lbs CO2/MMBtu. Natural gas electric generators also tend to be more efficient than coal generators, because they require less fuel to generate electricity.
In the 12 months from October 2015 through September 2016, coal and natural gas had nearly equal shares of electric power generation in the United States: 31% and 34%, respectively. However, their shares of electric power sector emissions were 61% and 31%, respectively, as coal is much more carbon-intensive. Overall electric power carbon intensity has also decreased as generation share of non-carbon-emitting fuels such as nuclear, hydropower, wind, and solar has grown.
Emissions from the transportation sector are primarily from motor gasoline, distillate fuel oil, and jet fuel, which have carbon intensities lower than coal but higher than natural gas. For example, gasoline emits an average of 157 lbs of CO2/MMBtu. In the 12 months from October 2015 through September 2016, motor gasoline represented 60% of the total emissions from the transportation sector, while 23% was from distillate fuel oil and 12% was from jet fuel.
Very little electricity is used in the transportation sector. Attributing transportation’s share of electric power sector emissions to the transportation sector would only add 4 MMmt CO2 to the transportation sector’s total of 1,893 from October 2015 through September 2016.
Principal contributors: Cara Marcy, Bill Sanchez