U.S. crude oil exports are increasing and reaching more destinations
The number of countries receiving exported U.S. crude oil has risen since the removal of restrictions on exporting U.S. crude oil in December 2015. U.S. crude oil exports have occurred despite relatively small price spreads between international crude oils and domestic crude oils, as well as other factors that should reduce crude oil exports such as falling U.S. crude oil production and added cargo export costs.
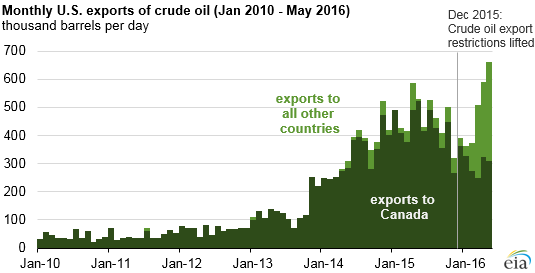
Based on the latest available data, U.S. crude oil exports averaged 501,000 barrels per day (b/d) in the first five months of 2016, 43,000 b/d (9%) more than the full-year 2015 daily average. U.S. exports of crude oil had already increased significantly before the lifting of crude oil export restrictions. These exports were mostly to Canada, which was excluded from the previous restrictions. From 2000 to 2013, U.S. exports rarely surpassed 100,000 b/d. By 2015, the United States was exporting 422,000 b/d to Canada and a total of 26,000 b/d to five other countries.
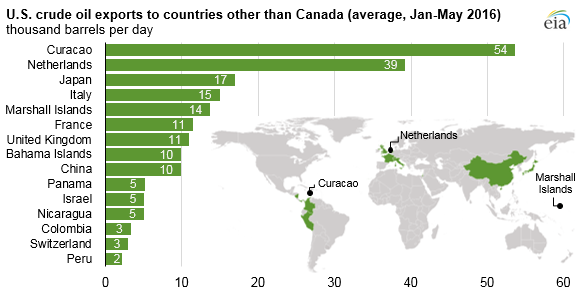
In recent years, crude oil exports to destinations other than Canada were often re-exported volumes of foreign crude oil or cargoes of Alaskan crude oil, which were both exempt from export restrictions. As discussed in the August 10 This Week in Petroleum, the number and variety of destinations for U.S. crude oil exports has increased since the lifting of restrictions. So far in 2016, U.S. crude oil has been exported to 16 different nations, totaling 501,000 b/d.
U.S. crude oil exports to countries other than Canada have surpassed exports to Canada in two months in 2016. In March, total crude oil exports to countries other than Canada reached 259,000 b/d, or 10,000 b/d more than crude oil exports to Canada. In May, total U.S. crude oil exports to countries other than Canada reached 354,000 b/d, 46,000 b/d more than crude oil exports to Canada.
Other than Canada, the largest and most consistent U.S. crude oil export destination for the first five months of 2016 has been Curacao, an island nation located in the Caribbean Sea north of Venezuela. U.S. crude oil exports to Curacao averaged 54,000 b/d through May. Petróleos de Venezuela (PDVSA), the state-owned oil company of Venezuela, operates the 330,000 b/d Isla refinery on Curacao, as well as crude and petroleum product storage facilities on the island. Trade press reports indicate that U.S. crude oil exports to Curacao are likely being used as diluent, where a light (less dense) U.S. crude oil is blended with a heavy Venezuelan crude oil, for either processing at the Isla refinery or for re-export to PDVSA customers.
Continued increases in U.S. crude oil exports will likely depend on increases in U.S. crude oil production and significantly wider price differences between domestic and international crude oils, neither of which are projected in EIA's August Short-Term Energy Outlook. More information about U.S. crude oil exports and the factors that affect U.S. crude oil trade is included in the August 10 This Week in Petroleum.
Principal contributor: Mason Hamilton
Tags: Canada, crude oil, exports/imports, international