U.S. Energy Information Administration logo
Skip to sub-navigation
August 22, 2011

Recently, S&P 500 Index and WTI crude oil futures price movements tracked each other
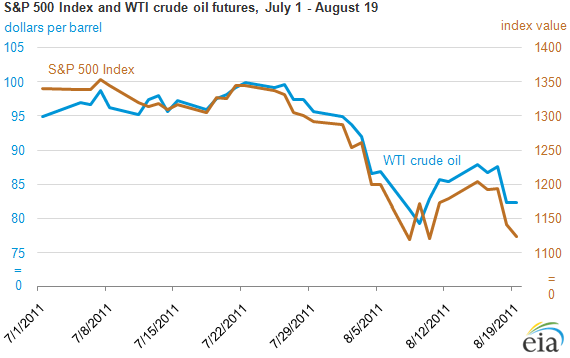
graph of S&P 500 Index and WTI crude ouil futures, July 1-August 19, as described in the article text
Source: U.S. Energy Information Administration based on Bloomberg data.
Note: Closing values at settlement times, 2:30 PM EST for near-month WTI futures prices and 4:00 PM EST for the S&P 500.

Over the past few weeks (July 1 through August 19), the movement of oil prices has closely mirrored that of the Standard and Poors (S&P) 500 Index. Crude oil settlement futures prices for West Texas Intermediate (WTI) crude fell just over 13% while the S&P 500 stock index fell 16% during this period. Recent economic news, such as a downward revision to U.S. GDP for the first half of this year, has provided downward price pressure across many asset classes during recent trading sessions.

The recent strong relationship between oil and equity prices resembles that seen during the economic downturn and recovery in 2008-2010. This contrasts with a weaker correlation between oil and equity prices in the years before 2008 and also with price movements earlier this year, when oil and stock markets decoupled. One notable exception to this recent price correlation came on August 9. When the WTI near-month futures price settled at 2:30 on August 9, the S&P 500 index was roughly unchanged from the day before. However, the S&P 500 index rallied after the close of the WTI near-month futures contract and finished up almost 5% for that trading session.

See EIA's Oil Price Formation website for a discussion of how the historical relationship between oil, equity prices, and other asset classes—for example, currencies, bonds and treasury notes, metals, and agricultural commodities—has changed over time.

Statistics
Analysis
Tools
Education
News

Petroleum & Other Liquids

Crude oil, gasoline, heating oil, diesel, propane, and other liquids including biofuels and natural gas liquids.

Natural Gas

Exploration and reserves, storage, imports and exports, production, prices, sales.

Electricity

Sales, revenue and prices, power plants, fuel use, stocks, generation, trade, demand & emissions.

Coal

Reserves, production, prices, employment and productivity, distribution, stocks, imports and exports.

Nuclear & Uranium

Uranium fuel, nuclear reactors, generation, spent fuel.

Renewable & Alternative Fuels

Includes hydropower, solar, wind, geothermal, biomass and ethanol.

EIA Survey Forms

Forms EIA uses to collect energy data including descriptions, links to survey instructions, and additional information.

Total Energy

Comprehensive data summaries, comparisons, analysis, and projections integrated across all energy sources.

U.S. States

State energy information, including overviews, rankings, data, and analyses.

International

International energy information, including overviews, rankings, data, and analyses.

Environment

Greenhouse gas data, voluntary reporting, electric power plant emissions.

Data Tools, Apps, & Maps

Tools to customize searches, view specific data sets, study detailed documentation, and access time-series data.

Open Data

EIA's free and open data available as API, Excel add-in, bulk files, and widgets

EIA Beta

Come test out some of the products still in development and let us know what you think!

Open Source Code

EIA's open source code, available on GitHub.

RSS Feeds

Subscribe to feeds for updates on EIA products including Today in Energy and What's New.