Fires near Fort McMurray are reducing Canada’s oil sands production
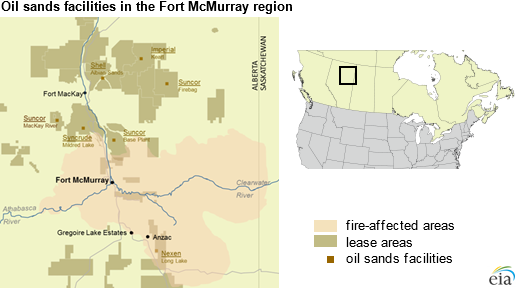
While evacuees from the ongoing fires in Fort McMurray have begun to return to the city, a state of emergency remains in place throughout Alberta, Canada, and the temporary shutdown of the area's oil sands production sites continues. EIA estimates that disruptions to oil production averaged about 0.8 million barrels per day (b/d) in May, with a daily peak of more than 1.1 million b/d. Although projects are slowly restarting as fires subside, it may take weeks for production to return to previous levels. EIA expects disruptions to average 400,000 b/d in June.
The oil sands facilities are located mostly to the north of the fires and initially were not physically threatened by the fires. However, as winds pushed the fires northward, oil sands facilities and work camps had to be evacuated. Oil sands production companies operating near Fort McMurray either shut down completely or operated at reduced rates. Although the fires have not been contained, they have moved away from Fort McMurray, but dangerous air quality conditions at facilities and surrounding towns have slowed the return of workers. As conditions improve, facilities located farther north of Fort McMurray have begun to restart production, although not at full capacity.
Local pipeline capacity was also shut down in response to the fire, reducing crude oil takeaway capacity. Oil sands production yields very thick crude oil that often requires liquid diluent such as natural gas condensates to reduce viscosity so that the crude oil can flow in pipelines. Because this diluent is delivered to the production area by pipeline, the pipeline shutdowns also affected this diluent supply.
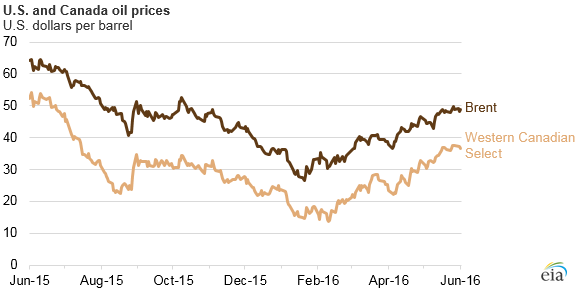
So far, the Fort McMurray fires have not significantly affected the regional crude oil price, Western Canadian Select (WCS). The price difference between WCS and the global crude oil benchmark Brent has narrowed slightly since the fires began, but WCS still remains at least $10 U.S. dollars per barrel less than Brent. The effect of the fire was most likely moderated by high inventories of crude oil in both the United States and Canada. Crude oil imports from Canada have fallen, but to a lesser extent compared with the oil sands production outage.
Oil sands operators use significant volumes of natural gas in their operations and for combined heat and power applications. Consequently, the oil production outages caused by the Fort McMurray fires have also led to decreased natural gas consumption and record-low Canadian natural gas prices. While Canadian spot prices rose in the early days of the fires, media reports estimated consumption of natural gas in Alberta fell by close to 25% in the immediate aftermath of the fires, and these declines in consumption pushed prices to record lows.
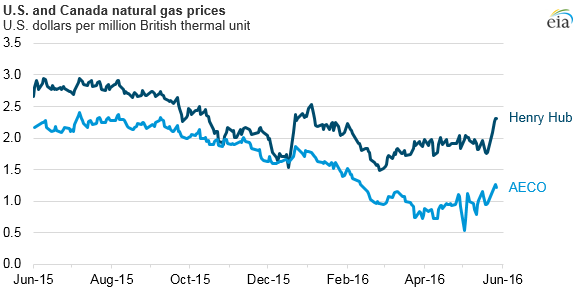
At the AECO trading point, a pricing hub for spot natural gas markets in Canada, prices dropped to $0.55 U.S. dollars per million British thermal units (MMBtu), their lowest price in the 14-year available history. Prices at AECO had been relatively low before the fires, due in part to high storage levels in the United States and Canada. According to some industry analysts, natural gas storage in Alberta is nearing capacity and could be full within the next few months.
Principal contributor: Laura Singer, Alex Wood