High inventories help push crude oil prices to lowest levels in 13 years
Several factors have played a part in pushing U.S. crude oil prices below $30 per barrel (b), including high inventory levels of crude oil, uncertainty about global economic growth, volatility in equity and nonenergy commodity markets, and the potential for additional crude oil supply to enter the market. Crude oil and petroleum product inventories, both domestically and internationally, have been growing since mid-2014 and are above five-year averages for this date.
Although there is still traditional, on-land storage space available, higher inventory levels and expectations for global inventories to continue building in 2016 are lowering crude oil and petroleum product prices for near-term delivery:
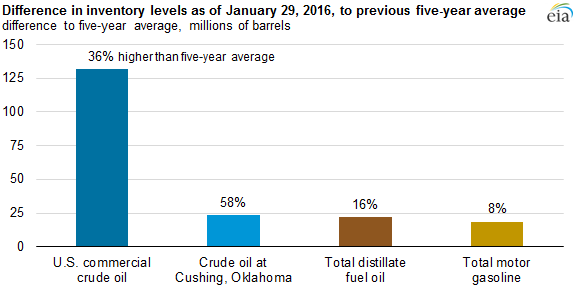
- Total U.S. commercial crude oil inventories as of January 29 were 503 million barrels, 132 million barrels above the 2011-15 January average. This marks the first time that U.S. inventories exceeded 500 million barrels.
- Crude oil inventories at Cushing, Oklahoma, the delivery point for the West Texas Intermediate (WTI) futures contract traded on the New York Mercantile Exchange (Nymex), are 23 million barrels above the five-year average as of January 29.
- Total U.S. distillate inventories (which include heating oil and diesel fuel) are 22 million barrels above the five-year average, and motor gasoline inventories in the United States also recently moved above historical averages.
When inventories are high and rising, costs to store crude oil and petroleum products generally increase. In futures markets, where people can buy commodities for specific delivery times in future months, high storage costs often mean that long-term deliveries are priced higher than near-term deliveries, a situation known as contango. One metric for this is the difference in contract prices between the front month (the most proximate future month) and the contract for one year out, known as the 13th-to-1st month spread, as shown in the graphic below.
From 2010 to 2014, when global liquid fuel oil inventories were generally declining, the front month contract for Brent crude oil traded higher than the futures delivery one year out. Since then, the market has changed. Through January 2016, Brent and WTI front month prices traded on average about $8/b lower than futures price for delivery one year out.
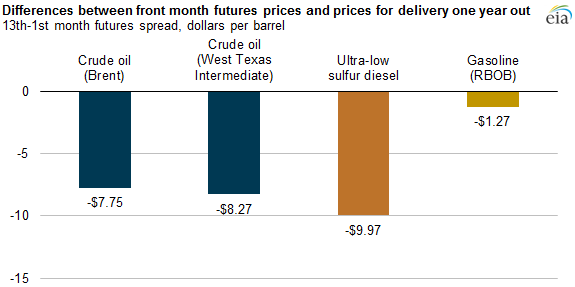
Note: RBOB is reformulated blendstock for oxygenate blending, the petroleum-based component of motor gasoline.
When front month futures prices reach large discounts to contracts for delivery of crude oil months or years in the future, market participants may store oil on ships, also known as floating storage. By purchasing crude oil on the spot market, selling a longer-dated futures contract, and chartering and manning a vessel, market participants can lock in their rate of return. Because of the costs associated with chartering a ship and manning it for several months, floating storage does not typically become economical until contango reaches $10-$12/b. Trade press and news reports do not currently indicate widespread amounts of crude oil being purchased for floating storage.
The shape of the futures strip, which represents the price of petroleum products for delivery at each contract month, also drives decisions regarding storage of diesel fuel and gasoline. Ultra-low sulfur diesel (ULSD) inventories in the United States have grown more than total motor gasoline inventories since mid-2014. Correspondingly, the discount of the front month gasoline contract to the futures contract for delivery one year in the future is significantly less than the discount for ULSD. With the distillate market in steep contango in January, small amounts of floating storage are being reported near ports located in northwest Europe, where low water levels in rivers have slowed deliveries of petroleum products.
Principal contributor: James Preciado
Tags: crude oil, diesel, gasoline, heating oil, liquid fuels