New pipeline projects increase Northeast natural gas takeaway capacity
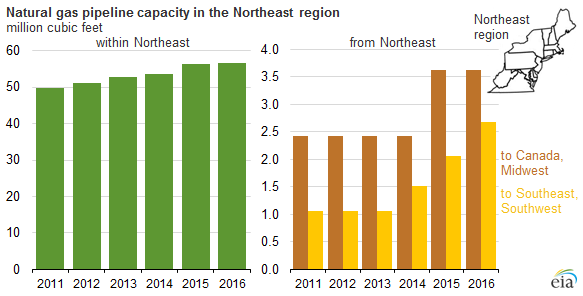
Note: Capacity in 2015 reflects a combination of existing and planned or under-construction projects. Capacity in 2016 reflects only planned projects.
A number of recently completed and upcoming natural gas infrastructure projects are expected to increase the reach of natural gas produced in the Marcellus and Utica regions of the Northeastern United States (see map). These projects are intended to transport natural gas from production centers to consuming markets or export terminals.
Over the past several years, natural gas production in the Marcellus and Utica areas has grown significantly: their combined growth of 12 billion cubic feet per day since 2011 accounts for 89% of the United States's total growth in natural gas production. The Marcellus and Utica shale plays are located primarily in Pennsylvania, West Virginia, and Ohio. The pipeline infrastructure discussed here is mainly in the Northeast region, which includes Pennsylvania and West Virginia, but not Ohio, based on the regional breakouts in EIA's natural gas pipeline data.
Partly as a result of strong domestic production growth, both domestic natural gas consumption and exports of natural gas by pipeline have increased, and exports of liquefied natural gas (LNG) from the United States are set to begin this year. However, because infrastructure projects often have longer lead times than production projects, infrastructure growth in the Northeast has not kept pace with production growth, and capacity has been insufficient to move natural gas out of the Northeast to demand centers and export locations.
In the past several months, several new pipeline projects have come online to move natural gas either to nearby market areas in the Mid-Atlantic area (New York, New Jersey, and Pennsylvania) or to feed into existing infrastructure that delivers natural gas to more distant regions, especially the U.S. Gulf Coast.
Key projects that came online in late 2015 or early 2016 include:
- The Rockies Express Pipeline (REX) reversal project had added westbound capacity to flow natural gas to the Midwest in 2014. In late 2015, Texas Eastern Transmission Company’s (Tetco) OPEN project added 550 million cubic feet per day (MMcf/d) of pipeline takeaway capacity out of Ohio.
- Columbia Gas Pipeline's East Side Expansion, a 310 MMcf/d project that flows natural gas produced in Pennsylvania to Mid-Atlantic markets.
- Tennessee Gas Pipeline's Broad Run Flexibility Project, a 590 MMcf/d project originating in West Virginia that moves natural gas to the Gulf Coast states.
- Tetco’s Uniontown-to-Gas City project flows up to 425 MMcf/d of natural gas produced in the Marcellus region to Indiana.
- Williams Transcontinental Pipeline's Leidy Southeast project provides additional capacity to take Marcellus natural gas to Transco's mainline, which extends from Texas to New York. From there, the natural gas serves Mid-Atlantic market areas as well as the Gulf Coast.
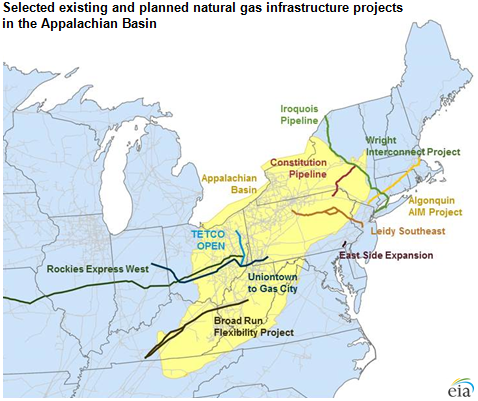
Several other projects plan to add natural gas transmission capacity later in 2016: The Algonquin Incremental Markets expansion project will add 342 MMcf/d of capacity to Algonquin Gas Transmission's pipeline in the highly constrained New England region. The Constitution Pipeline will have the capacity to transport up to 650 MMcf/d of natural gas from the Appalachian Basin to the Iroquois Gas Transmission and Tennessee Gas Pipeline systems in New York, which will provide access to markets in the Northeast and New England. The Wright Interconnect Project expands Iroquois's facilities and supports the Constitution Pipeline where the Iroquois and Constitution pipelines interconnect in Wright, New York.
Other projects currently under construction, including liquefaction projects in Maryland and along the U.S. Gulf Coast, will enable natural gas produced in the Appalachian Basin to reach markets overseas.
More information about existing natural gas pipeline infrastructure is available in EIA's spreadsheet of State-to-State Capacity. Projects that are planned or under construction are listed in the Pipeline Projects spreadsheet.
Principal contributors: John Krohn, Katie Teller