Working natural gas inventories below last year's level at midpoint of injection season
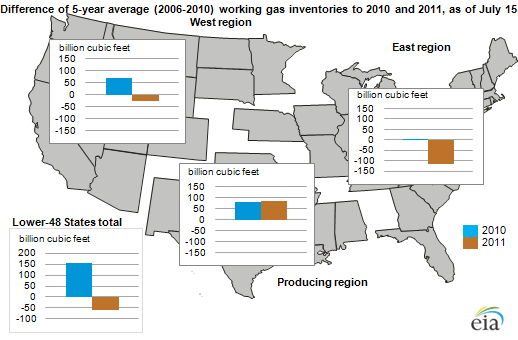
At the halfway point of the natural gas injection season, which traditionally runs from April 1 through October 31, working natural gas inventories for the lower 48 States as of July 15 are about 7.4% lower than the inventory level for the same time last year (working gas is essentially the gas in storage that can be accepted from or delivered to customers) and about 2.2% lower than the most recent 5-year average. Current inventories reflect sharp differences between the East, West, and Producing regions.
In both the East and West regions, the current volume of working natural gas in storage is trailing last year's volume—8.5% and 20.1% lower, respectively, whereas the Producing region natural gas storage inventories are 0.4% higher than last year's volume. Relative to the 5-year average (2006-2010), current inventories in the East and West regions are 8.3% and 6.7% lower, respectively, whereas in the Producing region stocks are 9.3% higher.
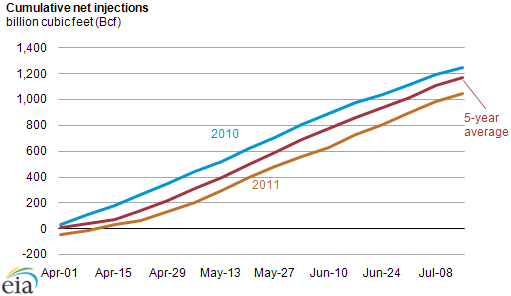
These lower storage levels are contrast with the situation last year at this time when both the East and West regions had stronger inventory levels than the prior year, and the Producing region was below its previous-year levels. Despite inventory levels at the end of March above the 5-year average, cumulative net injections this year are over 20% lower than in 2010. Elevated levels of nuclear outages and periods of warmer-than-normal weather likely contributed to the lower pace of net injections.
At the end of October 2010, working natural gas inventories marked an all-time high of 3,847 billion cubic feet (Bcf). EIA's July Short-Term Energy Outlook (STEO) projects total end-of-season natural gas inventories of 3,819 Bcf, or 28 Bcf short of last year's all-time record. Based on inventory levels as of July 15, this projected end-of-season level implies a net average injection of 74.5 Bcf per week, or 10.6 billion cubic feet per day, for the remainder of the refill season.
Tags: map, natural gas, storage