Household heating costs are expected to be lower than previous two winters
Note: Propane price is weighted average of Midwest and Northeast prices.
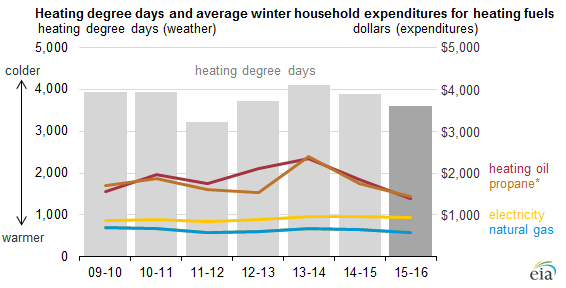
Most U.S. households can expect lower heating expenditures this winter (October through March) compared with the past two winters. In most regions, the decline in expenditures is attributed to the combination of warmer weather and lower fuel prices.
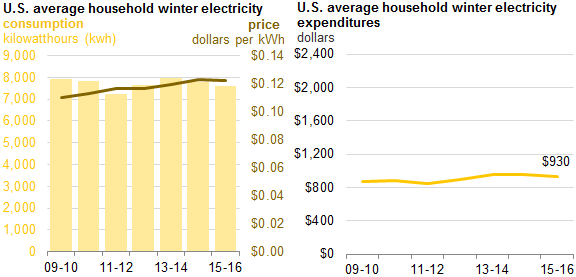
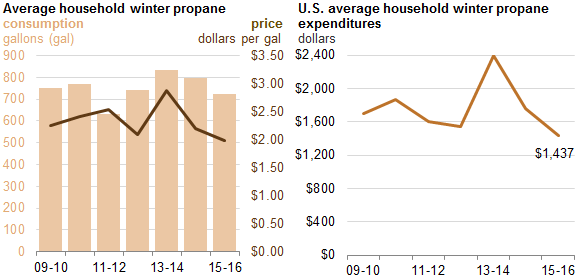
According to EIA's Winter Fuels Outlook, average household expenditures for homes heating primarily with natural gas will total $578 this winter, a $64 decline from last winter's average. Homes primarily using propane are expected to spend $1,437 this winter ($322 less). Homes heating primarily with heating oil are expected to spend $1,392 ($459 less). Homes heating primarily with electric heat are expected to spend $930 ($30 less). The average household winter heating fuel expenditures summarized above provide a broad guide to changes compared with last winter. However, fuel expenditures for each household are highly dependent on the size and energy efficiency of individual homes and their heating equipment, thermostat settings, local weather conditions, and market size.
Most regions of the country are expected to have warmer weather this winter. The Northeast, Midwest, and South are expected to be about 13%, 11%, and 8% warmer, respectively, based on forecasts from the National Oceanic and Atmospheric Administration (NOAA). The West, which had unusually warm weather last winter, is expected to have 12% cooler weather. Because weather patterns present great uncertainty to winter energy forecasts, EIA's Winter Fuels Outlook includes projections for 10% colder and 10% warmer scenarios.
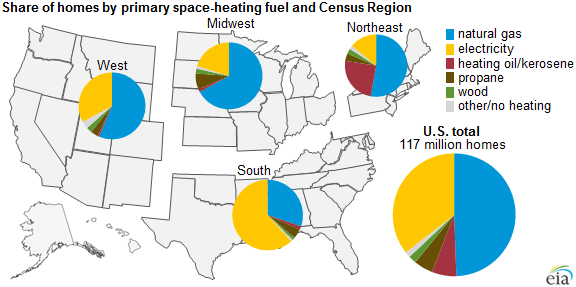
Additionally, the choice of heating fuel varies considerably by region, resulting in regional differences in total expenditures. Natural gas is the primary space heating fuel in every region except the South, where electric heating is more prevalent. Heating oil is much more common in the Northeast than in other regions, while propane is more common in the Midwest than it is elsewhere, although it is still a small portion of the total (see map).
Details of the winter outlook for individual fuels are discussed below:
Source: U.S. Energy Information Administration, Short-Term Energy Outlook, October 2015
Note: Winter covers the period October 1 through March 31.
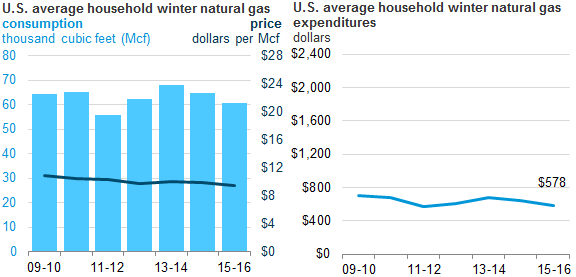
Almost half of U.S. households use natural gas as their primary heating fuel. EIA expects households heating with natural gas to spend an average of $64 (10%) less this winter than last winter. The decrease in natural gas expenditures is the net result of 6% lower fuel consumption, and 4% lower residential natural gas prices compared to last winter. Heading into the heating season, EIA projects storage inventories will total 3,956 billion cubic feet, which would be a record high.
Source: U.S. Energy Information Administration, Short-Term Energy Outlook, October 2015
Note: Winter covers the period October 1 through March 31.
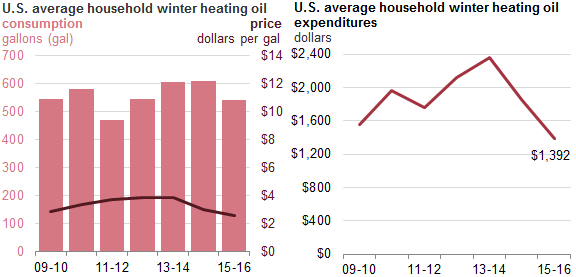
EIA expects households heating primarily with heating oil to spend an average of $459 (25%) less this winter than last winter, reflecting an 11%, weather-related decrease in consumption, and a 47-cent-per gallon (15%) decrease in prices. Reliance on heating oil is highest in the Northeast, where about 22% of households depend on heating oil for space heating; nationwide, only 5% of households, use heating oil. Distillate fuel inventories on the East Coast, which includes the Northeast, are higher going into the heating season than they have been for the past three years.
Source: U.S. Energy Information Administration, Short-Term Energy Outlook, October 2015
Note: Winter covers the period October 1 through March 31.
Households heating primarily with electricity are expected to spend an average of $30 (3%) less this winter, with prices 1% lower and consumption 2% lower than last winter. About 39% of all U.S. households rely on electricity as their primary heating fuel, ranging from 15% of households in the Northeast to 63% in the South. Overall, electricity expenditures are less sensitive to winter heating demand because, unlike other heating fuels, electricity is also used to power dozens of appliances and equipment within a home, making the overall level of demand less weather-sensitive.
Source: U.S. Energy Information Administration, Short-Term Energy Outlook, October 2015
Note: Winter covers the period October 1 through March 31.
About 4% of all U.S. households heat with propane. EIA expects that households heating with propane in the Midwest will spend an average of $320 (21%) less than last winter, reflecting prices that are about 13% lower and consumption that is 9% lower than last winter. Households in the Northeast are expected to spend an average of $342 (15%) less this winter, with average prices that are about 5% lower and consumption 11% lower than last year. U.S. and Gulf Coast propane inventories reached a record high on September 25, 2015.
Nearly 2.5 million households (2%) used wood as their primary residential space heating fuel in 2014, which represents a 33% increase since 2005. About 8% of households use wood as a secondary source of heat, making wood second only to electricity as a supplemental heating fuel. Unlike the other home heating fuels, there are no readily available sources for estimating wood consumption or prices at the regional or national level. EIA will collect additional wood consumption data in the 2015 Residential Energy Consumption Survey.
Principal contributor: Stacy MacIntyre