California’s continued drought, reduced snowpack mean lower hydropower output
Updated at 9:20 a.m. to include the most recent drought information from California, released this morning.
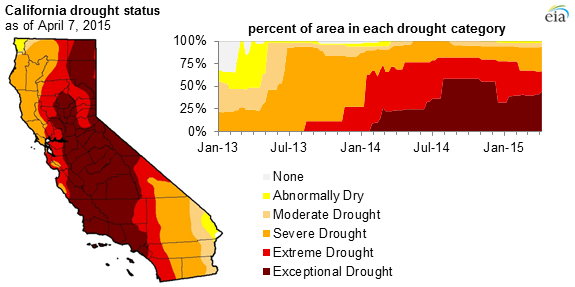
Earlier this month, California Governor Jerry Brown enacted mandatory water restrictions for the first time in the state's history. While the executive order doesn't directly address hydropower generation and instead focuses on water use in cities and towns, the drought that began in 2011 has had a noticeable effect on hydropower. Furthermore, reduced levels of snowpack likely mean that hydropower output will be low throughout the summer.
California's drought caused a state of emergency to be declared in January 2014. Since then, the drought has worsened, and, as of April 7, 2015, 44% of the state is now classified as experiencing exceptional drought, the most intense drought category. The drought has limited the state's ability to generate electricity from its hydropower plants. For instance, the California Department of Water Resources reports that 2013-14 precipitation in the Northern Sierra, where some of California's largest hydropower plants are located, was 37% below the historical average. Precipitation in 2015 continues to be exceptionally low.
Availability of water may worsen over the coming months because current snowpack (accumulated winter snowfall) in California is at record low levels. Snowpack levels indicate how much water will be available to fill reservoirs and power hydropower generators throughout the year. With the combination of above-average temperatures and below-normal precipitation this past winter, snowpack is far below normal. The California Department of Water Resources reports that statewide snowpack as of April 8 is just 8% of the average amount to date. Given the record-low snowpack, water from melting snow will in all likelihood be insufficient to replenish already depleted reservoirs. The length of the drought has made it even harder to refill reservoirs because the soil is parched; much of the precipitation that does fall will likely be absorbed before making it to the reservoirs.
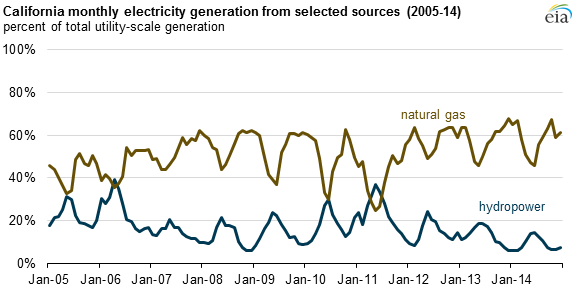
Lower output from California's hydropower generators is not a new trend, as hydropower generation in California has generally decreased over the past 10 years. During this time, increased natural gas-fired generation has offset both the seasonal fluctuations and the long-term decline in hydropower generation.
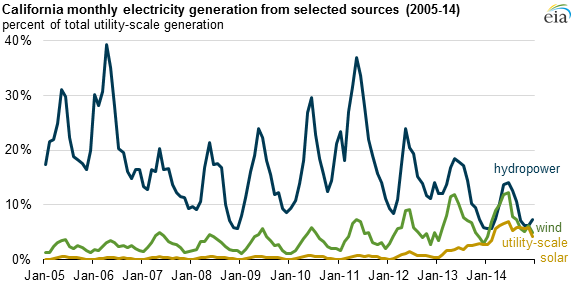
The decline in hydro generation has also been mitigated by increased wind and solar power in California. While the annual average contribution from hydropower to electricity generation in California decreased from 23% in 2011 to 9% in 2014, wind doubled its generation contribution from 4% to 8% and utility-scale solar generation grew from less than 1% to 5% over the same period.
Principal contributor: Michelle Bowman
Tags: California, electricity, generation, hydroelectric, map, states, weather