
Falling rig counts drive projected near-term oil production decline in 3 key U.S. regions
Republished March 17, 2015, 10:00 a.m., text was modified to clarify content.
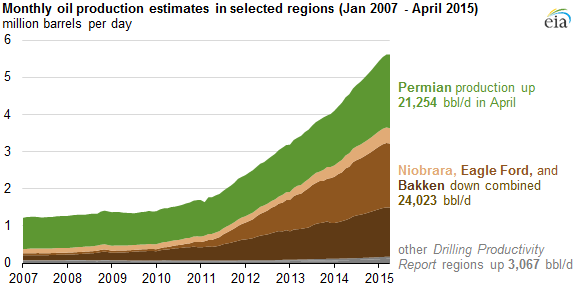
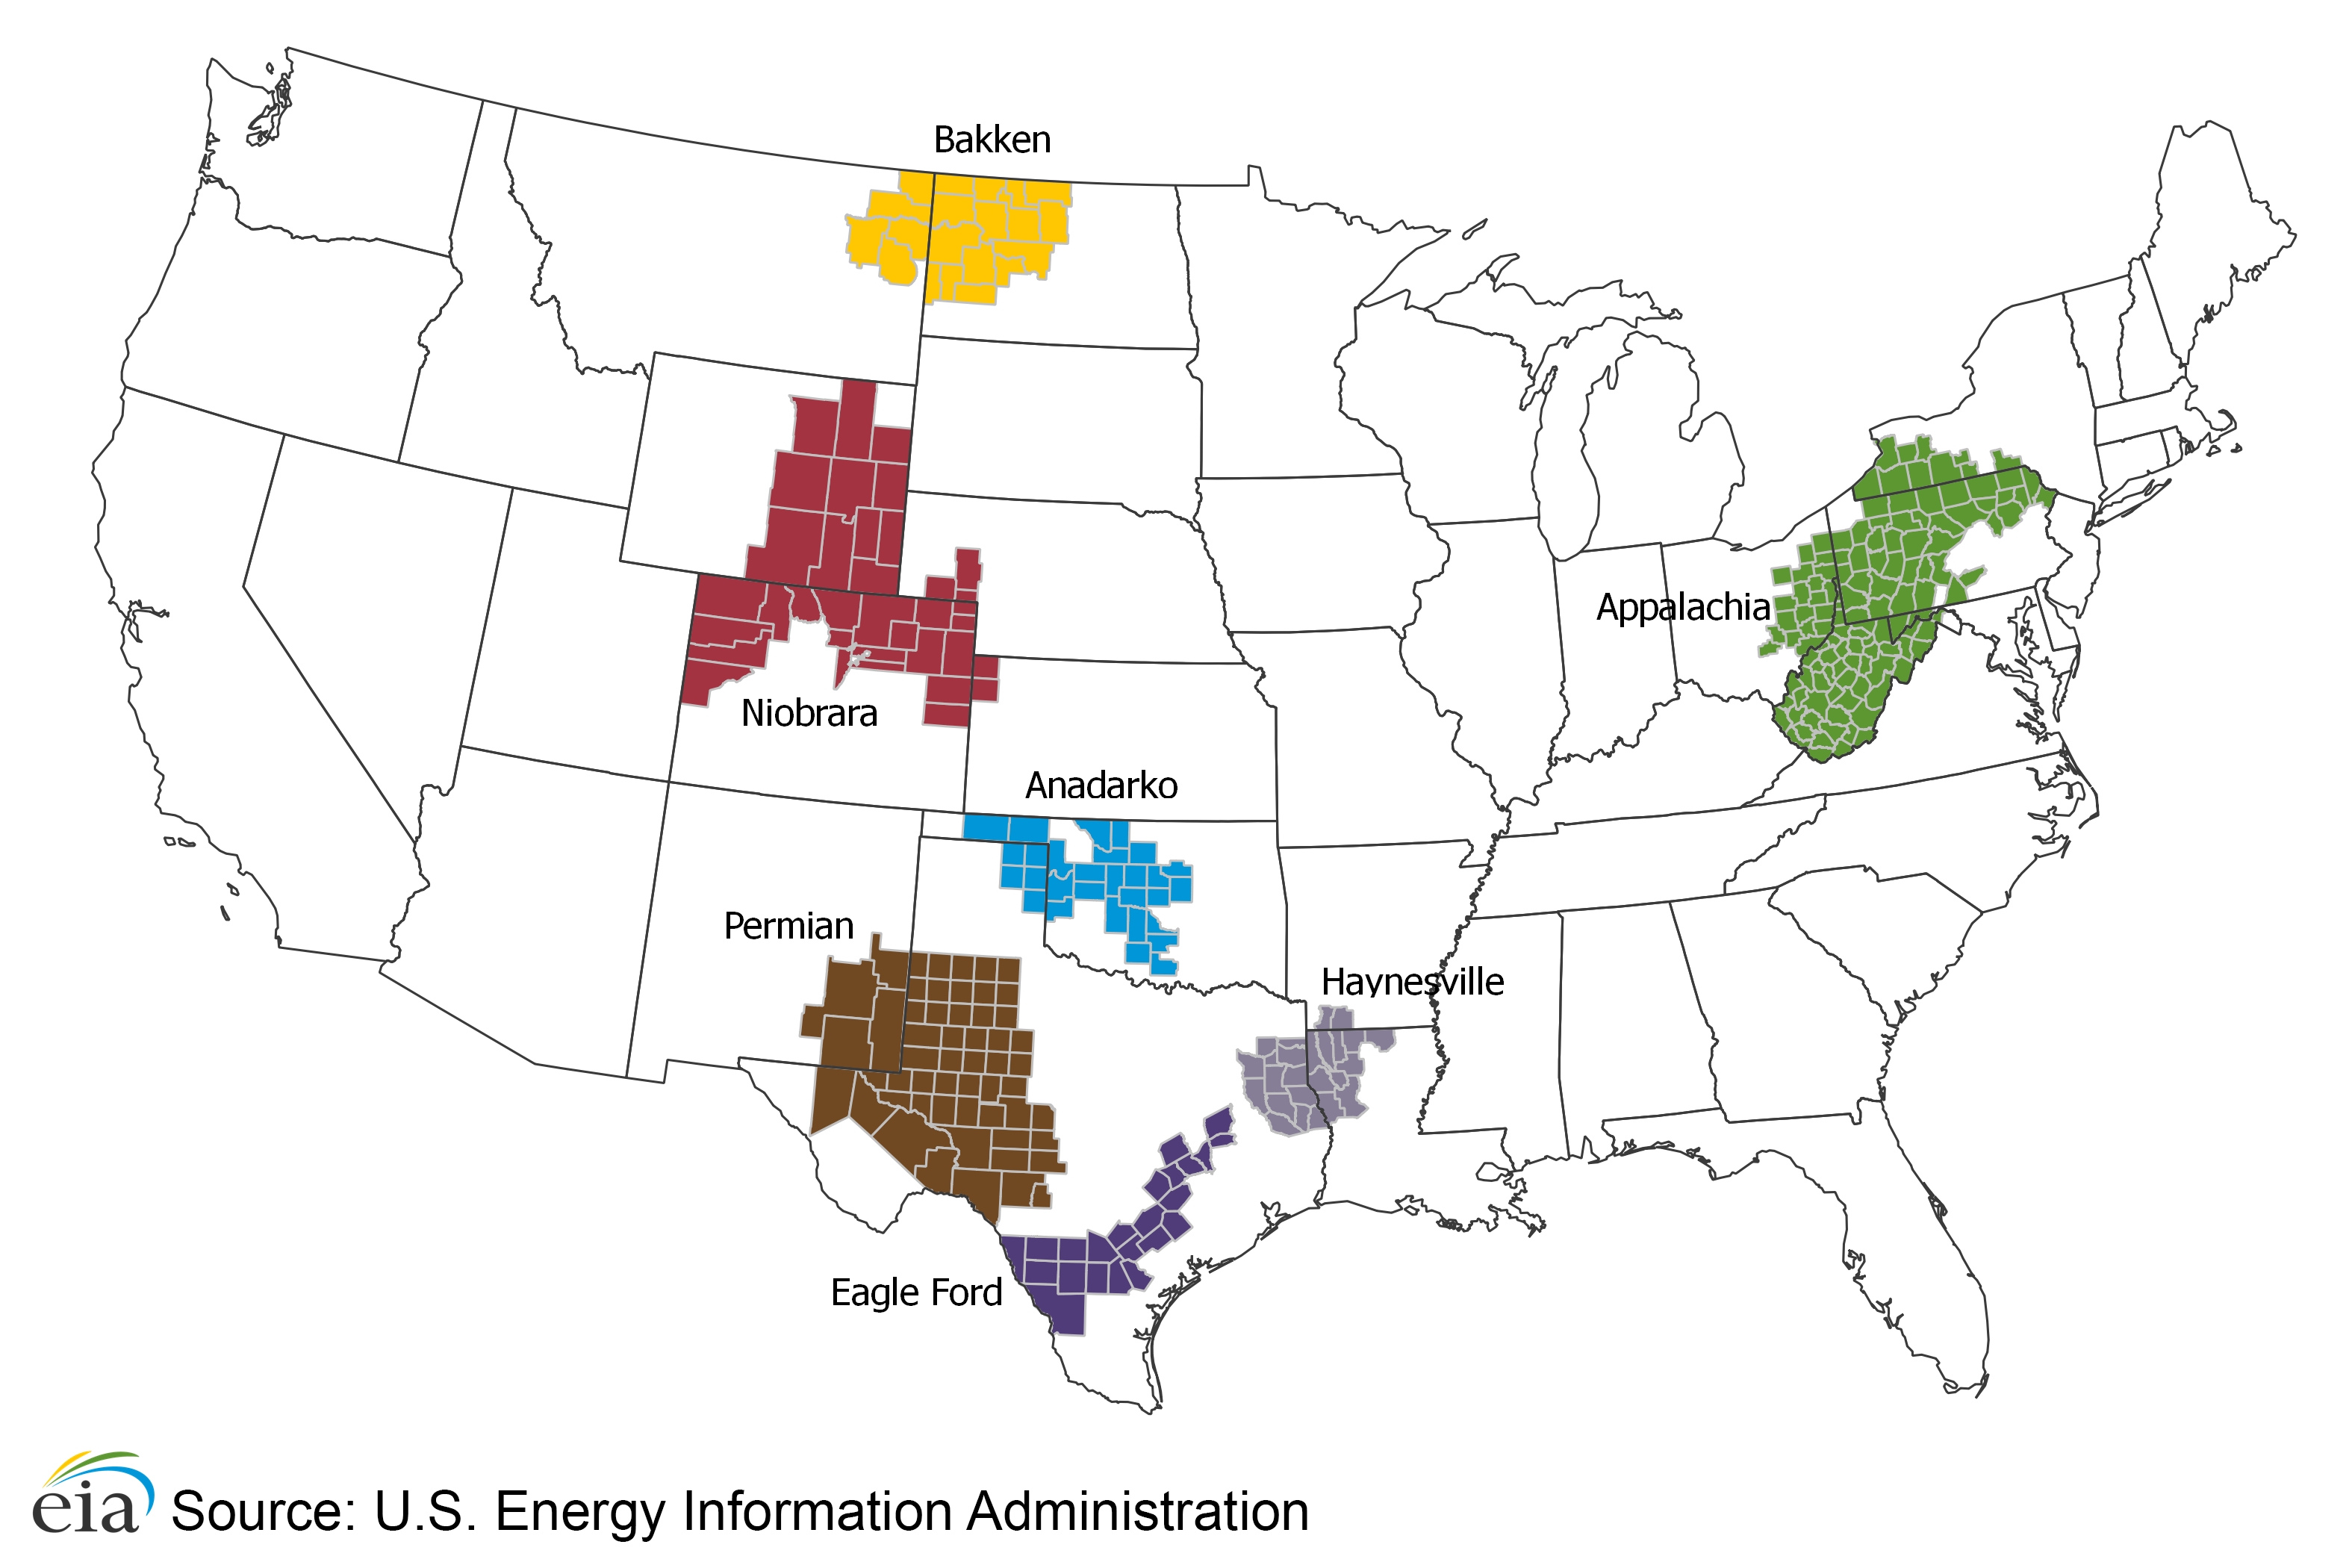
EIA's most recent Drilling Productivity Report (DPR) indicates a change in the crude oil production growth patterns in three key oil producing regions: the Eagle Ford, Niobrara, and Bakken. The DPR estimates, which were issued on March 9 and cover the months of March and April, include the first projected declines in crude oil production in these regions since publication of the DPR began in October 2013. However, with production gains continuing in other regions, particularly the Permian, overall crude oil production in regions tracked by the DPR rose slightly in March to 5.6 million barrels per day. Total production in the DPR regions in April is expected to be virtually unchanged from its March level.
In any given month, there are new wells and legacy, or continuing, wells. Production from legacy wells declines over time, but recently the rate of decline in some regions has been increasing. This means that, in order for overall production to increase, operators must drill enough new wells to overcome the decline from legacy wells. As fewer wells are drilled, this decline becomes a significant challenge to overcome.
The recent decline in crude oil prices has led operators to reduce the number of rigs in use. DPR results show sharp decreases in rig counts in all regions, starting in January and February of this year. When producers make the decision to lay down some drilling rigs, they generally start by idling the older, least-efficient ones first. The effect on production depends on the productivity of the remaining rigs.
For example, falling crude oil prices during the 2008-09 recession led to decreases in rig counts, but not decreases in production. At that time, lower rig counts were more than offset by increases in the productivity of remaining rigs, as those more productive rigs required fewer days to drill and complete a well, had higher initial production rates, and were more able to drill multiple horizontal wells from a single pad. Because the base level of rig performance is so much higher now than several years ago, it is not clear that productivity gains will offset rig count declines to the same degree as in 2008-09.
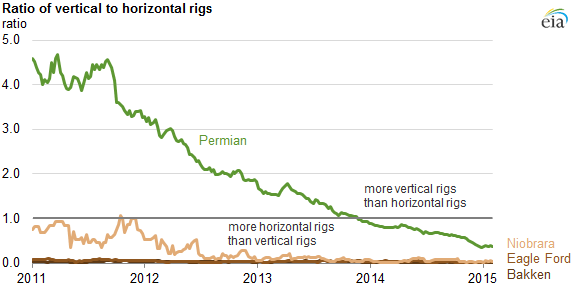
The Permian region, where as late as December 2013 half the operating rigs were vertical rigs, still appears to be experiencing significantly larger productivity improvements than other DPR regions. In general, average production from a vertical well is significantly smaller than that from a horizontal well. As more vertical rigs are brought offline, the ratio of vertical to horizontal rigs in the Permian, which has only fallen below 1:1 in recent months, is coming closer to, but remains above, the vertical-to-horizontal rig ratio in the other DPR regions.
Principal contributors: Jozef Lieskovsky, Richard Yan