
Natural gas prices drop following strong production growth
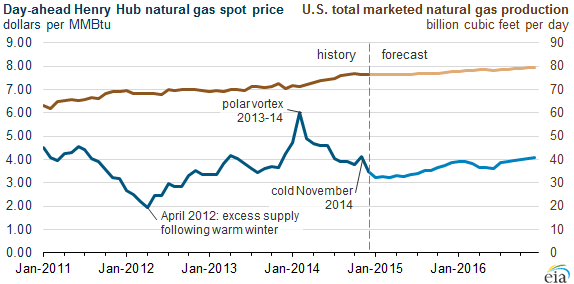
Following a short-lived price increase in November, natural gas prices have dropped to their lowest levels since September 2012, reflecting strong domestic production and inventory builds.
The 2013-14 winter's sustained cold weather and record drawdown of inventories led Henry Hub prices to spike to five-year highs, peaking at a monthly average of $6.00 per million British thermal units (MMBtu) in February 2014. Heading into the summer injection season, inventories were at an 11-year low and almost one trillion cubic feet (Tcf) lower than five-year (2009-13) average levels. Prices remained elevated through the spring and early summer of 2014, but dropped as domestic production continued to set new records and inventory rebuilds remained strong.
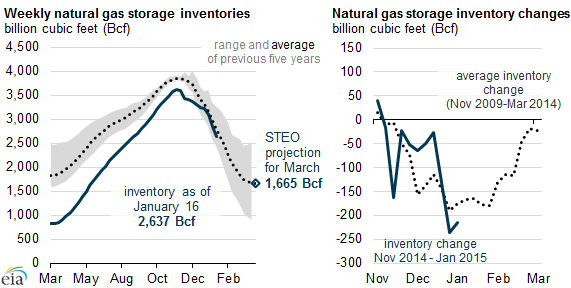
The 2014-15 winter heating season began with colder-than-average temperatures in November. Prices at the national benchmark Henry Hub rose to the mid-$4/MMBtu range, possibly reflecting supply concerns and expectations of another extremely cold winter. For the week ending November 21, 2014, inventory levels fell by 162 billion cubic feet (Bcf), tying the largest weekly November withdrawal on record. Since then, smaller-than-average withdrawals for most of this winter have brought stock levels back above year-ago levels and closer to five-year average levels.
In recent weeks, prices have dropped to the lowest levels in more than two years; on December 23, 2014, day-ahead Henry Hub spot prices fell to $2.97/MMBtu, the first time they were below $3/MMBtu in more than two years. Since the end of December, both spot and futures prices have hovered around the $3 mark, and closed at $2.92 and $2.88, respectively, on January 26. Preliminary data sources show increased natural gas production through early winter, with production rebounding quickly from freeze-offs in November and early January.
Based on National Oceanic and Atmospheric Administration (NOAA) projections for close-to-normal weather for the rest of winter, the January Short-Term Energy Outlook (STEO) expects inventory levels will be close to the five-year average for the rest of the winter and will enter the summer injection season at 1,665 Bcf. The strength in inventory builds, as well as expectations for continued production growth, contribute to relatively low forecasted prices throughout the year. EIA also expects monthly average prices will remain below $4/MMBtu through most of 2015 and 2016.
Principal contributor: Katie Teller
Tags: natural gas, prices, production/supply, storage