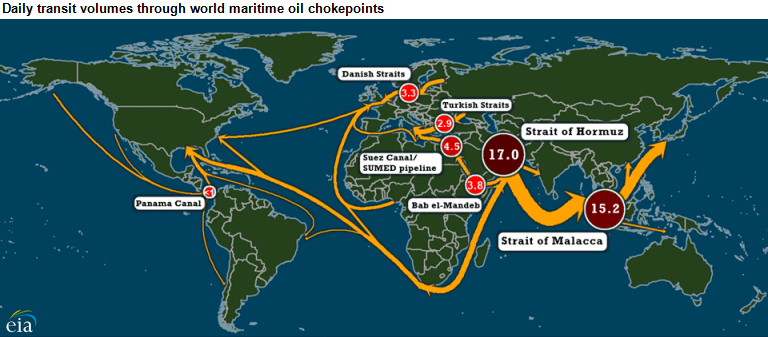
World oil transit chokepoints critical to global energy security
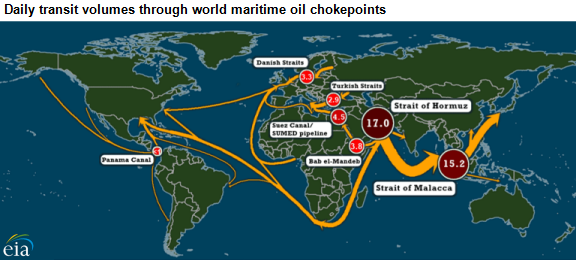
Note: All estimates in million barrels per day. Includes crude oil and petroleum products. Based on 2013 data.
Note: Click to enlarge.
International energy markets depend on reliable transport routes. About 63% (56.5 million barrels per day) of the world's oil production in 2013 moved on maritime routes. World chokepoints for maritime transit of oil are a critical part of global energy security because of the high volume of petroleum and other liquids transported by these routes.
Blocking a chokepoint, even temporarily, can lead to substantial increases in total energy costs and world energy prices, as disruptions to these routes can affect oil prices and add thousands of miles of transit in alternative routes. Chokepoints also leave oil tankers vulnerable to theft from pirates, terrorist attacks, shipping accidents that can lead to disastrous oil spills, and political unrest in the form of wars or hostilities.
The Strait of Hormuz, leading out of the Persian Gulf, and the Strait of Malacca, linking the Indian and Pacific Oceans, are the world's most important strategic chokepoints measured by volume of oil transit, accounting for a combined 57% of all seaborne oil trade.
In 2013, about 17 million barrels per day traveled through the Strait of Hormuz, which connects the Persian Gulf with the Gulf of Oman and the Arabian Sea.
The Strait of Malacca is the shortest sea route between the African and Persian Gulf suppliers and the Asian consumers. At the end of 2013, trade through Malacca was 15.2 million barrels per day.
The Suez Canal and SUMED Pipeline, located in Egypt, are strategic routes for Persian Gulf oil and natural gas shipments to Europe and North America. The Bab el-Mandeb Strait is a chokepoint between the Horn of Africa and the Middle East, and it is a strategic link between the Mediterranean Sea and the Indian Ocean. The Danish Straits and the Turkish Straits are key oil export routes to Europe for Russia and other Eurasian countries, including Azerbaijan and Kazakhstan.
Over time, the relevance of the Panama Canal and the Trans-Panama Pipeline to global oil trade has diminished. Many modern tankers are too large to travel through the Panama Canal, and falling oil production from Alaska's North Slope decreased oil volumes going through the pipeline. However, the Panama Canal is undergoing an expansion, scheduled to be completed next year, that will allow transit of larger ships with greater volumes, including liquefied natural gas tankers.
The increase in U.S. domestically produced crude oil is changing trade patterns through world chokepoints. Historically, U.S. refiners have been major consumers of African crude oil, primarily light sweet crude from Nigeria, Algeria, and Angola. However, with increased U.S. production of light, sweet crude, the U.S. has imported less crude oil from Africa, and more African crude has been sent to Asia through the Strait of Malacca.
For more information, see the World Oil Transit Chokepoints special analysis brief.
Principal contributors: Alexander Metelitsa, Megan Mercer