
U.S. petroleum product exports increase in 2013
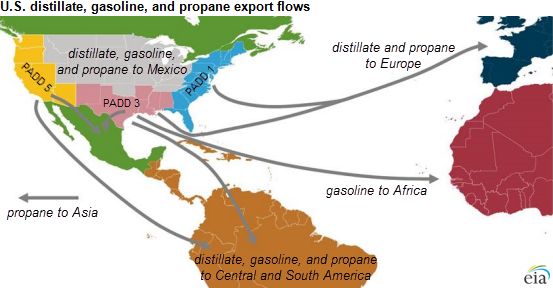
Note: PADD is Petroleum Administration for Defense Districts.
Exports of petroleum products from the United States averaged 3.5 million barrels per day (bbl/d) in 2013, 10% more than in 2012. The increase in exports was broad-based, affecting multiple products going to multiple regions. In December 2013, U.S. exports of petroleum products reached 4.3 million barrels per day, the first time exports exceeded 4 million barrels per day in a single month.
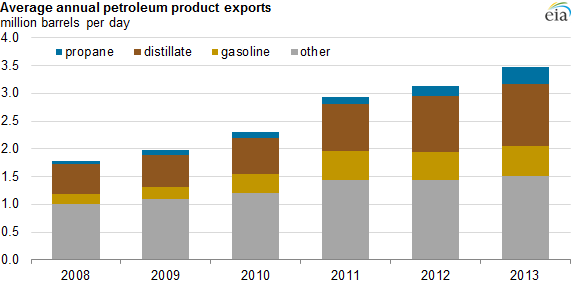
Note: "Other" includes petroleum coke, residual fuel oil, jet fuel, and other hydrocarbon gas liquids.
Average exports of distillate fuels exceeded 1.1 million bbl/d in 2013, an increase of 110,000 bbl/d over the level in 2012. Cost-advantaged domestic crude oil and natural gas encouraged near-record-high refinery runs, and 2013 distillate fuel production increased 160,000 bbl/d over 2012. The largest increases in distillate export volumes were those destined for Central and South America, already the largest destination for U.S.-produced distillate fuel. U.S. distillate exports to that region increased by 60,000 bbl/d, reaching 550,000 bbl/d in 2013. Exports of distillate fuel to Europe increased by 50,000 bbl/d to an average of 400,000 bbl/d in 2013.
Exports of propane averaged 300,000 bbl/d in 2013, a 130,000 bbl/d increase over the level in 2012. Almost half of all 2013 propane exports went to Central and South America, while exports to Europe doubled from 2012 levels to 55,000 bbl/d. In 2013, U.S. propane production increased by 110,000 bbl/d compared to 2012, while consumption grew by 90,000 bbl/d. Continued propane production growth in excess of consumption over several years filled propane inventories to 75.8 million barrels in October 2012, the highest level since 1998. Elevated inventories and increases in propane production contributed to the increase in export volumes in 2013.
Gasoline exports increased by 45,000 bbl/d in 2013, averaging 550,000 bbl/d for the year. December 2013 gasoline exports set a monthly record of 770,000 bbl/d. Gasoline exports increased to Africa, Central and South America, and Mexico.
The United States continues to import significant amounts of petroleum products (2.1 million bbl/d on average in 2013); however, imports are generally declining. Although the Gulf Coast is a large net exporter of gasoline, given present infrastructure constraints the East Coast continues to import substantial amounts of gasoline from Europe and Canada. Likewise, imports play a critical role in supplying distillate and propane during the winter, particularly on the East Coast, when in-region production along with shipments from other regions are insufficient to meet the increases in demand, especially during very cold weather, as much of the country experienced this past winter.
Principal contributors: Tim Hess, T. Mason Hamilton