EIA now delivers coal data through new interactive browser
Last week, the U.S. Energy Information Administration launched an interactive, online Coal Data Browser that brings together in a single tool comprehensive data on the U.S. coal industry.
The Coal Data Browser gives users easy access to coal information from EIA's electricity and coal surveys as well as data from the Mine Safety and Health Administration and trade information from the U.S. Census Bureau.
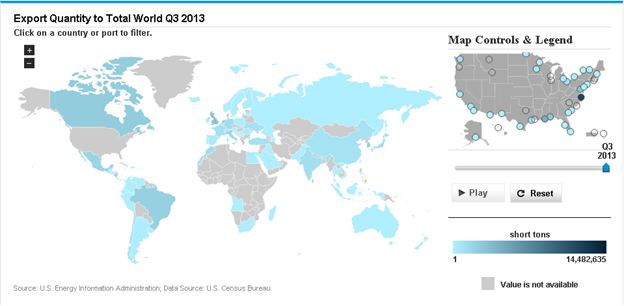
For example, the map above shows the distribution of U.S. coal exports across the globe, as well as a ranking of the U.S. ports from which the coal was shipped. By clicking on a given port, users can see which countries are served by that particular port. Similarly, by clicking on an individual country, users can see all ports serving that country. Users of the coal data browser can even animate coal trade over time, by quarter, to see how demand for U.S. coal exports has changed since 2000.
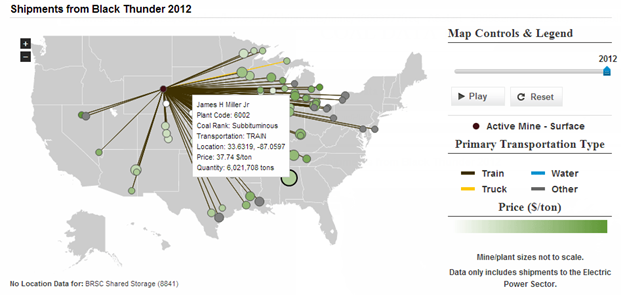
Users can also see the shipment data from individual mines that deliver coal to the U.S. electric power fleet. The map above shows shipments data in 2012 from the Black Thunder mine, by primary transportation type and the average delivered price per ton to power plants in the electric power sector. Users also have the ability to track supplies delivered to a given power plant and to see which mines serve each particular plant.
All the time series datasets in the Coal Data Browser have also been released to EIA's data application programming interface (API) to allow application developers access to these datasets.
See the tabs below for more examples of the types of data visualization possible with the Coal Data Browser, or go to the browser itself.
Source: U.S. Energy Information Administration
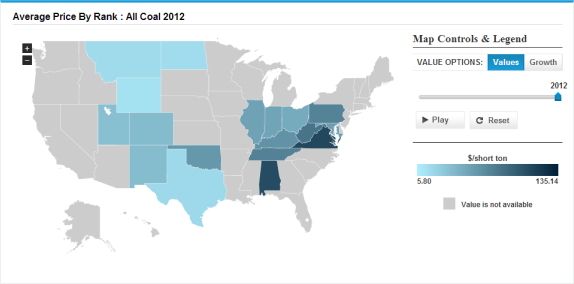
Coal price data on a national level; see more of this analysis.
Source: U.S. Energy Information Administration
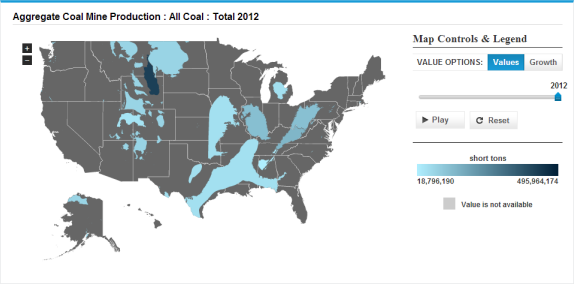
Coal production data on a basin level; see more of this analysis.
Source: U.S. Energy Information Administration
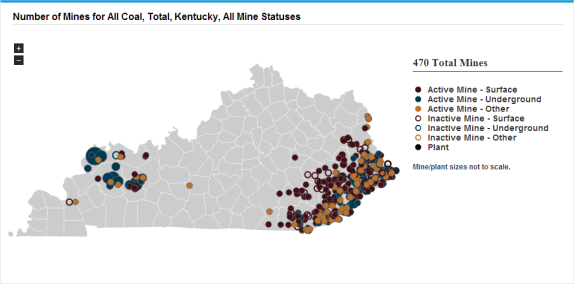
Mine data on a state level; see more of this analysis.
Source: U.S. Energy Information Administration
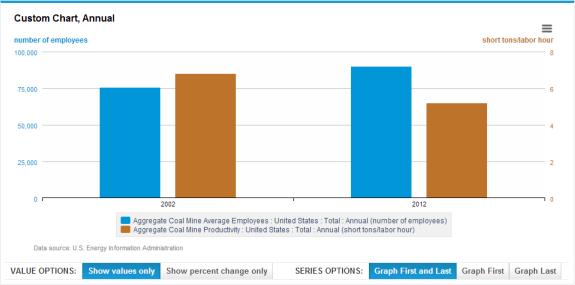
The Coal Data Browser is also able to graph selected data (see example, above), similar to the functionality of the Electricity Data Browser.
Principal contributor: Tyson Brown