
Net crude and petroleum products imports fell relative to other major net import flows
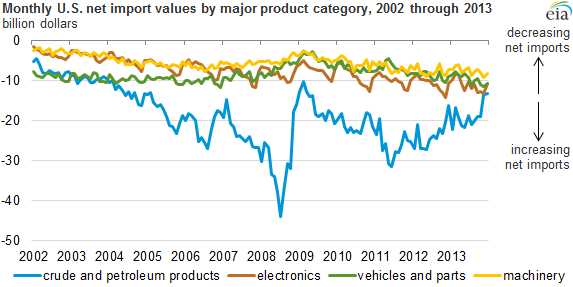
Note: Net imports are expressed as negative values.
Changes in crude oil and petroleum products trade account for most of the recent narrowing of the total U.S. trade deficit. Monthly trade data show the value of crude and petroleum products net imports was roughly equal to the value of electronics net imports in November 2013, and close to the value of net imports of both machinery and vehicles and parts. The monthly oil and petroleum trade deficit had significantly exceeded that of other major commodity categories since it broke away from vehicles and parts in 2004.
These four commodity groupings comprise about 82% of total net imports for 2013 and represent the four largest categories for both imports and exports last year.
Source: U.S. Census Bureau: Foreign Trade Division
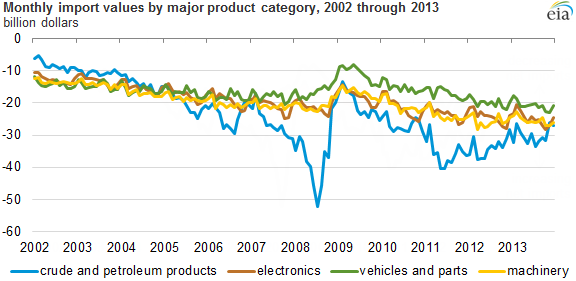
Note: Imports are expressed as negative values.
The value of crude and petroleum products imports declined 11% from 2012 to 2013, whereas vehicles and parts, and electronics have seen 4% and 2% year-on-year growth, respectively. Foreign vehicle sales growth is part of a larger trend in total vehicle sales growth in the United States. Within electronics, cell phone and mobile devices imports have increased about 12% from 2012 to 2013, while television and video equipment imports have declined.
Source: U.S. Census Bureau: Foreign Trade Division
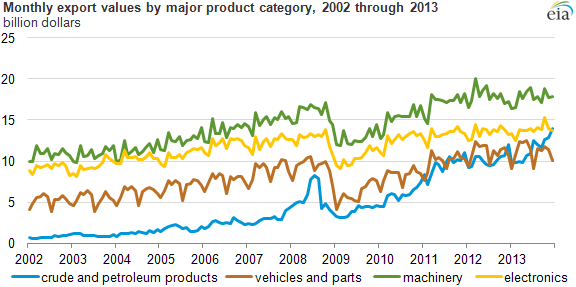
The value of crude and petroleum exports increased by 11% year-on-year. Aerospace, the fifth largest export category (not graphed) also saw double digit growth from 2012 to 2013. Total U.S. exports increased by about 2% in year-on-year, as did electronics. Machinery and vehicles and parts exports were flat, changing by less than a percentage point from 2012 levels.
The data discussed above are for selected Census product groupings. Another way to consider trade data focuses on end-use categories. Using this approach, capital goods is the largest absolute trade category, with imports exceeding exports by a small margin. The large net import balances are found with consumer goods (including electronics), energy fuels, and the automotive sector. Industrial equipment and agriculture have substantial trade that result in positive export balances.
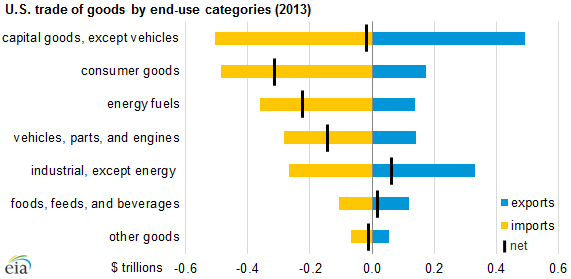
Note: The product grouping of machinery falls across capital goods and industrial.
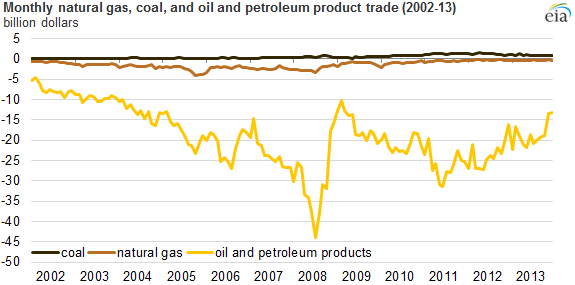
Crude oil was the largest single U.S. import by value among all goods in 2013, as it has been for many years.
Principal contributors: Robert McManmon, Michael Ford