Eagle Ford production increasingly targets oil-rich areas
Note: EIA calculates the initial GOR for each well using the second through fourth contiguous months of liquid and gas production. The first month of production is not included in the initial GOR calculation
Note: Click to enlarge.
Most wells now being drilled for hydrocarbons produce a mixture of oil and natural gas. Relatively high oil prices and low natural gas prices make the oil-rich portions of reservoirs more desirable for production, and therefore increasingly the targets for the drilling of new wells.
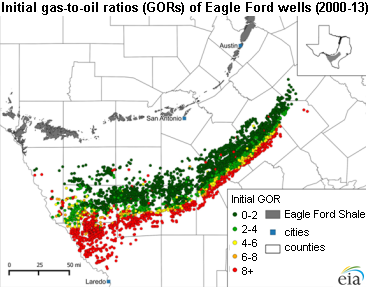
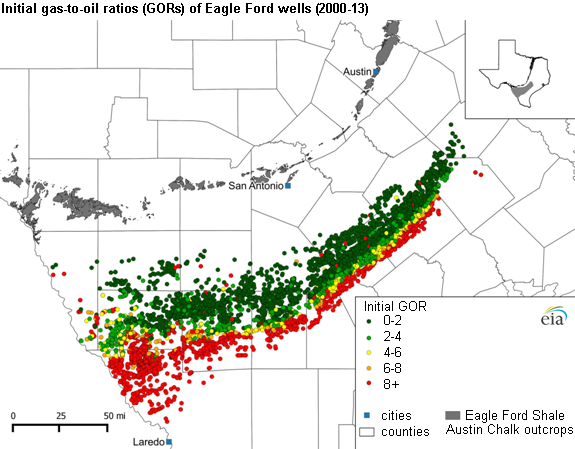
The mixture of oil and natural gas can be shown for a particular formation by mapping initial gas-to-oil ratios (GORs; the ratio of natural gas that a well produces to oil, expressed as thousand cubic feet per barrel—Mcf/bbl). In the map above, high initial GOR, or gas-rich wells, of the Eagle Ford play in Texas are shown in orange and red along the southern edge of the play, and lower initial GORs, or oil-rich wells, in green along the northern portion. Most Eagle Ford wells began production in 2009 or later, as shown in the animation below, which displays both the GOR and production of total hydrocarbons in barrels of oil equivalent (BOE).
Note: EIA calculates the monthly GOR from each month's production. The size of the bubbles in the chart represents the relative size of total well production for each month expressed in terms of barrels of oil equivalent (BOEs), which for the purposes of this graphic divides natural gas production in thousand cubic feet by six and adds the quotient to oil production in barrels.
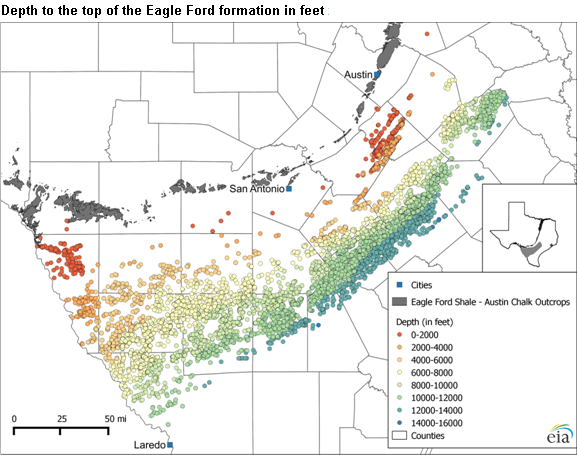
The distribution of initial GORs from Eagle Ford wells generally corresponds to the depth of the reservoir. Deeper wells (up to 15,000 feet) to the southeast have higher initial GORs, or a relatively greater share of natural gas, while the shallower wells to the northwest (below 6,000 feet) have lower initial GORs, or a relatively greater share of oil. In the eastern half of the play, the wells that intersect the reservoir between 5,000 and 13,000 feet depth produce initial GORs of 6 Mcf/bbl or less (producing more oil). The western half of the play includes a wider depth distribution of wells intersecting the formation from as deep as 14,000 feet to as shallow as 6,000 feet and has initial GORs of 6 Mcf/bbl or higher (producing more gas).
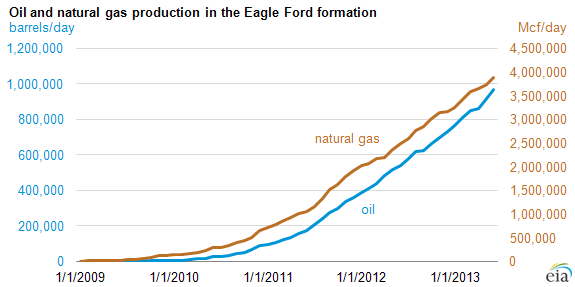
While initial GORs in the Eagle Ford have indicated a greater focus on oil production, production of both oil and natural gas from new and existing wells has increased over time. Monthly oil production from Eagle Ford wells increased from 340 barrels per day (bbl/d) in January 2009 to nearly 1 million bbl/d in June 2013. Natural gas production has increased at a similar rate over the same period, from 5.8 million cubic feet per day (MMcf/d) to nearly 4,000 MMcf/d. Oil and natural gas production volumes from the Eagle Ford reported here are slightly less than production reported in EIA's Drilling Productivity Report (DPR). The DPR reports production from all wells in all counties overlaying the Eagle Ford Play. In this report, only production from wells with production reported as being from the Eagle Ford formation is included.
Principal contributors: Margaret Coleman, Gary Long, Elizabeth Panarelli
Tags: drilling, Eagle Ford, liquid fuels, map, natural gas, oil/petroleum, Texas