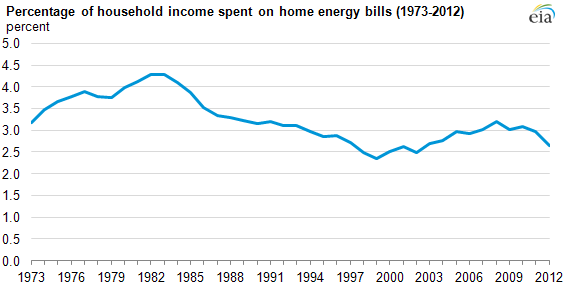
Lower residential energy use reduces home energy expenditures as share of household income
Note: Data exclude household transportation expenditures. Download CSV Data
Republished May 15 to correct text.
Consumers spent 2.7% of their household income on home energy bills last year, the lowest percentage in 10 years. Aggregate home energy expenditures by U.S. households fell $12 billion in 2012 from the 2011 level. In 2012, prices for residential natural gas decreased 3% from the previous year, while household electricity prices stayed about the same. Warmer weather contributed to lower energy consumption in 2012, and because household energy expenditures reflect both prices and consumption, these changes resulted in lower household energy expenditures.
On average, households spent $1,945 on heating, cooling, appliances, electronics, and lighting in 2012. This total includes home use of electricity, natural gas, fuel oil, propane, kerosene, wood, and coal but excludes fuels used for transportation. It also excludes other household utilities such as water and telephone services. Using EIA projections for 2012 based on household data from the U.S. Census Bureau through 2010, the $1,945 is 2.7% of household income for 2012, which is the lowest level since 2002. As shown in the graph above, the percentage of household income spent on home energy bills peaked at 4.3% in 1982 and steadily declined until it reached its lowest level since 1973 of 2.4% in 1999.
Additional data from the Bureau of Labor Statistics for 2012 show that spending on household energy is the eighth largest category of expenditures (see chart below). Shelter, transportation, and food represent nearly half of all consumer expenditures. However, the percentage of expenditures for home energy varies across income levels. For households in the lowest 20% of income (before taxes), energy bills average 6% of total expenditures, while for those in the highest 20% of income (before taxes), energy bills average only 3% of total expenditures.
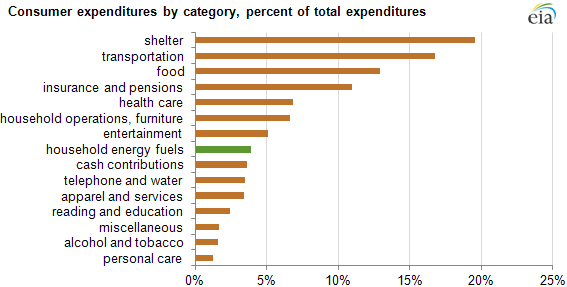
Note: Transportation includes vehicle purchases; gasoline and motor oil; other vehicle expenses such as finance charges, maintenance, and repairs; vehicle insurance, rentals, leases, and licenses; and public transportation. Download CSV Data
In February 2013, EIA published a Today in Energy article highlighting expenditures on gasoline as a share of household income.
Tags: consumption/demand, electricity, natural gas, prices, residential, weather