
Dry January lowers the Pacific Northwest water supply forecast for April through September
Note: Click map to enlarge.
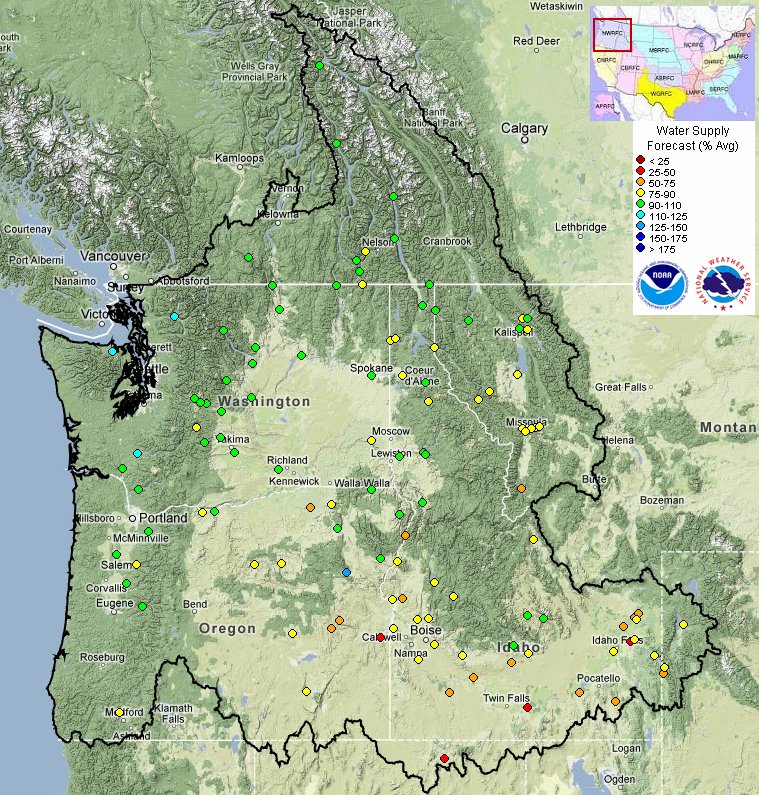
The Northwest River Forecast Center's (NWRFC) most recent 2013 projections for April to September—typically the high hydro season—call for normal to below-normal water supply. This outlook is similar to last year's, and significantly lower than 2011, which was an exceptionally high water year. Within the region, the driest forecasts relative to the norm are in the southeast, and the wettest forecasts are in the northwest. The water forecast is a key driver of EIA's short-term energy outlook for hydropower generation in the region.
For this year's forecast, the NWRFC shifted its reference period from 1971-2000 to 1981-2010, reflecting a drier measurement of normal. At the Dalles Dam on the Columbia River (a widely used reference point for the Pacific Northwest), the new 1981-2010 normal runoff is 101 million acre-feet, slightly lower than the 1971-2000 value of 107 million acre-feet.
The map above shows observation stations in the watershed region of the Pacific Northwest with forecasts for the percent-of-normal water supply for that station. The colors of the stations represent forecasted water supply levels above normal (blue), near normal (green and yellow), or below normal (orange and red).
Significant quantities of water flowing in the Northwest are used to generate electricity. Because water supply and the subsequent hydroelectric generation can vary widely from year to year, these water supply forecasts are particularly important for operators of all electric generators in this region.
The overall water supply is broadly made up of the:
- Precipitation that falls in a given time period
- Snowpack held throughout a watershed
- Subsequent runoff of the melting snow in the watershed
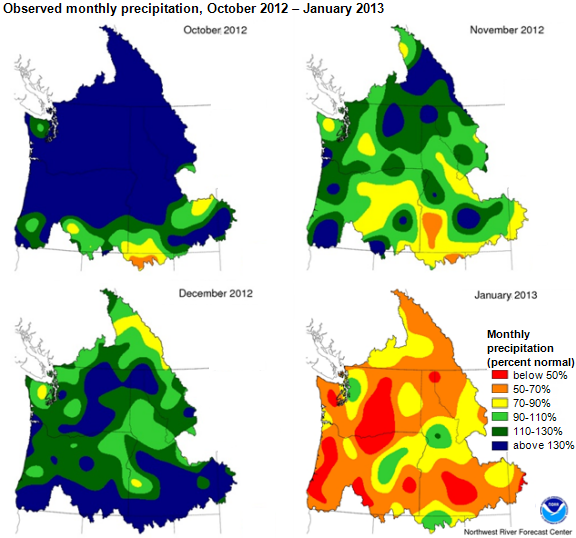
Northwest River Forecast Center tracks each of these phases in the water cycle. Precipitation in the region has varied this winter: a wet October (189% of normal, see maps below) was countered by a dry January (66% of normal). Temperatures were too high in October for that extra precipitation to build snowpack, and, as a result, snowpack levels are close to normal for most measuring stations.
The disposition of hydroelectric supply can greatly influence regional power prices. For example, during years when water is abundant, increased hydroelectric generation can drive down wholesale prices in Pacific Northwest markets. Hydroelectric supply can also have implications for the dispatch of other generators (such as wind turbines and thermal generators) in the Pacific Northwest, where four states (Washington, Oregon, Idaho, and Montana) host 35% of U.S. hydroelectric capacity. Hydroelectric output in 2011 was significantly above normal levels well into the summer, an unusual occurrence that drove down wholesale electricity prices in much of the western United States.
Tags: electricity, forecasts/projections, generation, hydroelectric, map, Northwest, prices, renewables, states, weather, wind