Canada Week: Natural gas net imports from Canada continue to decline
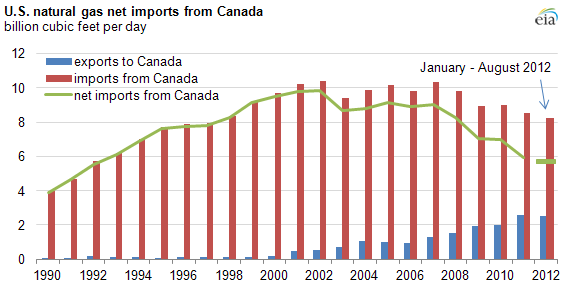
Note: Data for 2012 reflect averages of all months from Jan-August, 2012. Import and export volumes exclude in-transit gas.
Net imports of natural gas from Canada have been falling for years. Rising shale gas production in the United States, especially in the Northeast, is key among several factors affecting this trend. For the first eight months in 2012, net imports from Canada fell by about 7%, to 5.7 billion cubic feet per day (Bcfd), from the same period in 2011. This resulted from high levels of U.S. natural gas production coupled with record-high inventory in underground natural gas storage. United States net imports for 2012 year-to-date accounted for around 8% of U.S. total natural gas consumption, the lowest level since 1992.
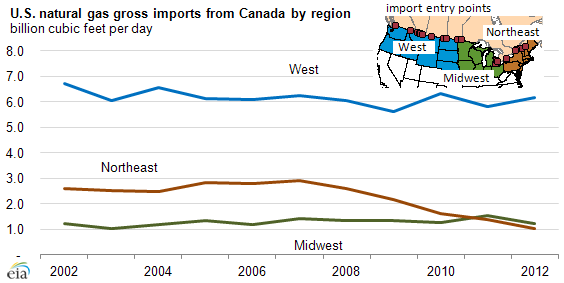
Note: Data for 2012 reflect averages of all months from Jan-August, 2012. Import and export volumes exclude in-transit gas.
Total U.S. natural gas imports from Canada have been decreasing every year since 2007. However, the decreasing trend does not apply to each region of the United States. Each region behaves differently, depending on the locations of supply sources and pipeline systems.
- Northeast: Canada helps supply natural gas to the Northeast in addition to gas coming from the Gulf of Mexico through several major long-haul pipelines and from the Everett LNG terminal near Boston. For the January-to-August periods, natural gas imports from Canada to the Northeast decreased by 19% on average annually since 2007 and by 26% from 2011 to 2012. Two factors contributed to this trend. First, natural gas imports through Maritimes & Northeast Pipeline into New England from the Canaport LNG terminal and from Sable Offshore Energy production have declined from around 0.5 Bcf/d at its peak to about 0.15 Bcf/d today. Second, significant natural gas production increases in the Marcellus Shale region over the past few years have displaced Canadian imports into the northeastern United States. In fact, in the past year, several major projects began services in the Northeast targeted at exporting Marcellus natural gas to Ontario, Canada.
- Midwest: Imports from Canada in the Midwest have been relatively stable over the years, but it's still on a downward trend. For the first eight months in 2012, imports from Canada in this region averaged 1.2 Bcfd, or about 14% below the 5-year average.
- West: In contrast, imports from Canada in the West increased slightly over the years. For the first eight months in 2012, imports from Canada in the West averaged 6.2 Bcfd, or about 6% and 3% above the previous year and the five-year average, respectively. This is because the natural gas prices at AECO-C Hub, which is the benchmark price of natural gas produced in Alberta, Canada, have often been the lowest-cost supplies for the western United States. Pipeline systems for imports in these regions are mostly operating at full capacity. According to Bentek's estimate, total Canadian dry natural gas production is down about 0.9 Bcfd so far this year (Jan. 1—Nov. 20, compared to the same period in 2011). Much of the natural gas imported by western states is redelivered to the Midwest through pipelines such as Northern Border and Alliance.
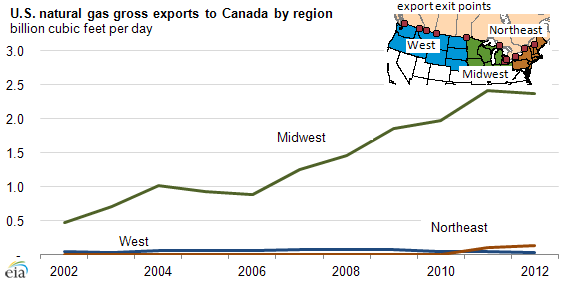
Note: Data for 2012 reflect averages of all months from Jan-August, 2012. Import and export volumes exclude in-transit gas.
Overall, U.S. exports to Canada have been growing significantly since 2000. Nearly all natural gas exports to Canada were delivered from the Midwest. The Vector Pipeline delivered most of the export volume to Canada. Expansions over the years allowed Vector to export more natural gas to Canada. Natural gas exports from the Midwest to Canada reached a record-high level in 2011, totaling 2.4 Bcfd, and have decreased slightly in 2012. The United States exports only a small volume of gas to Canada from the West and Northeast. However, natural gas exports from the U.S. Northeast to Canada have been rising since the beginning of 2011. For the first eight months in 2012, U.S. natural gas exports to Canada from the Northeast increased by about 32% from 2011 to about 0.1 Bcfd. Tennessee Gas Pipeline and National Fuel Gas Supply expansion projects commenced service on November 1, 2012, totaling 0.57 Bcfd of export capacities to Canada through Niagara, New York. The completed projects will significantly increase U.S. natural gas exports to Canada from the Northeast.
Tags: Canada, exports/imports, international, natural gas