Product Highlight: EIA’s Hourly Electric Grid Monitor
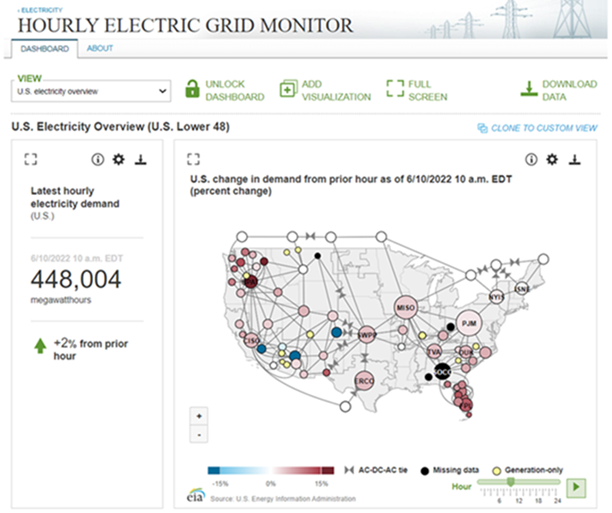
Our Hourly Electric Grid Monitor provides up-to-the-hour information on electricity demand across the U.S. electric grid. Large-scale, planned or unplanned, events that affect normal routines, ranging from major holidays to the COVID-19 pandemic, can change the pattern of electricity usage in the country.
The electric grid monitor is updated every hour with electricity demand for the prior hour. Hourly demand forecasts are available every morning at about 10:00 a.m. eastern time for the current day. Hourly electricity generation and total interchange data are available with a one-day lag. Most of the grid monitor’s data are available dating back to July 1, 2015, except generation by energy source and subregional demand data, which dates back to July 1, 2018.
Hourly electricity data are a valuable resource for understanding the daily, weekly, seasonal, and regional usage patterns of electricity consumption in the United States. Divergence from typical consumption patterns shows the effect current events are having on the U.S. grid.
The biggest drivers of hourly electricity consumption in the United States are temperature, time of day, and day of week. Electricity demand is highest during the daytime in the summer, which tends to have a distinct single-peak load shape. During the winter, electricity demand typically has separate morning and evening peaks. During the spring and the fall, U.S. electricity demand can be particularly volatile when temperatures swing significantly. Weekend U.S. electricity demand tends to be lower than weekday demand because schools and many businesses are closed.
On the Hourly Electric Grid Monitor, you can create, save, and share custom dashboards to monitor developments in electricity markets.
Principal contributor: EIA Staff