EIA Product Highlight: New England Dashboard
To increase customer understanding of energy interrelationships among electricity, natural gas, and petroleum products in New England, we provide an interactive dashboard that shows energy market and weather conditions in that region. The dashboard helps analysts and interested participants examine many key aspects of wholesale energy markets in New England.
We update our New England Dashboard every day by 10:30 a.m. eastern time, including weekends. The dashboard includes information on:
- Regional temperatures
- Various fuel prices
- Locational marginal prices of electricity
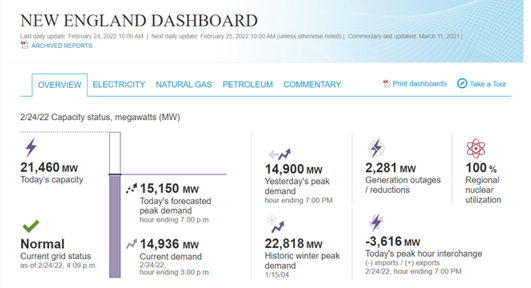
- The status of the electric grid, outages, and available capacity
- Current and projected electricity loads
- Liquefied natural gas (LNG) imports
- The electricity generation fuel mix
- Interregional electric transmission and natural gas flows
- Petroleum product stocks
Sources for the dashboard are a mix of real-time, daily, and monthly information and include both EIA and third-party data. Key series from third-party sources include:
- Actual and forecast temperatures from the National Oceanic and Atmospheric Administration
- Various electric price, load, generation, interchange, operating statistics, and fuel mix information from the Independent System Operator New England (ISO-NE)
- Natural gas demand, LNG imports, and natural gas pipeline flows from IHS Markit
- Crude oil and petroleum product prices from Refinitiv
- Spot natural gas and electricity prices from S&P Global Market Intelligence
The commentary section provides analysis of recent New England energy market conditions when a situation warrants more insight.
Principal contributor: EIA Staff