EIA Product Highlights: State Energy Portal and State Energy Data System
The U.S. Energy Information Administration (EIA) made it easier to access and use state-level energy information in 2019. The first improvement came with the release of the State Energy Portal, which provides greater access to state-level U.S. energy data with interactive, customizable views of more than 150 charts, tables, and maps that display more than 1,700 state-level and region-level data series.
While visualizing data for a state, users can add other state, regional, or U.S. data to make quick comparisons and filter by data frequency, time period, geographic location, energy source, and sector. EIA added new features that allow users to download charts and embed them in their own websites. Users can also create personalized interactive dashboards with the option to retain their settings.
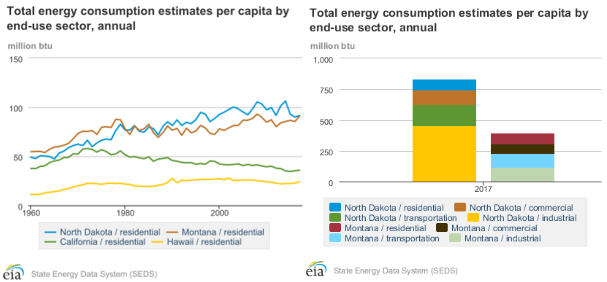
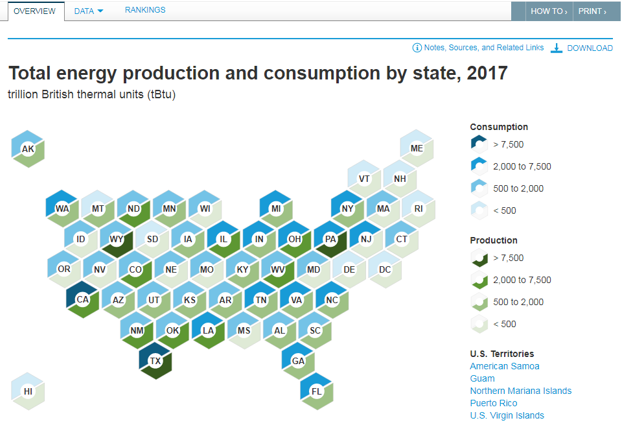
The second improvement focused on the State Energy Data System (SEDS), which provides comprehensive annual state-level estimates of energy production, consumption, prices, and expenditures by source and sector. This year, EIA added a Key Statistics and Indicators section that makes complete time-series data by state easier to access and provides state rankings tables for the most current year of available data.
EIA’s time-series data for U.S. state-level energy consumption and production begin in 1960, and data for prices and expenditures begin in 1970. In addition, the new section provides data on state-level population and (from 1997 forward) gross domestic product (GDP) to assist users with analysis.
Principal contributors: Stacy Angel, Pauline George, Mickey Francis
Tags: states