Wholesale power prices in 2016 fell, reflecting lower natural gas prices
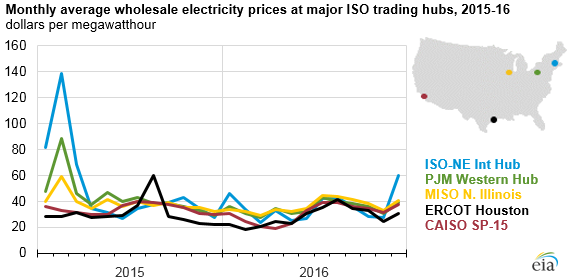
Average wholesale electricity prices at major trading hubs across the United States during the first quarter of 2016 were significantly lower than during the same period in 2015, ranging from 24% lower in California to 64% lower in New England. Monthly wholesale prices for the rest of 2016 were slightly below 2015 prices and generally averaged between $20 and $45 per megawatthour (MWh). The primary driver of the low wholesale electricity prices was the sustained low cost of natural gas, which is the fuel that often determines the marginal generation cost in most power markets. The low cost of natural gas also encouraged increased use of the fuel for U.S. power generation in 2016.
The cost of natural gas delivered to power generators averaged $2.78 per million British thermal unit (Btu) during the first 10 months of 2016 (the latest data available), which was 17% lower than the average price during the same period in 2015. Milder winter weather in early 2016 also helped keep power prices lower than during the winter of 2014–15 when wholesale prices in the Northeast peaked in response to cold temperatures and constraints on getting fuel into the region. The average wholesale electricity price in ISO New England in February 2016 averaged $34/MWh, significantly lower than the $138/MWh average during February 2015. Wholesale power prices began slowly increasing in December as colder winter weather set in, which led to increasing natural gas prices.
In addition to keeping wholesale power prices relatively stable in 2016, the low cost of natural gas contributed to a shift towards increased natural gas-fired electricity generation, largely at the expense of coal-fired generation. The amount of electricity generation fueled by natural gas between January and October 2016 was 6% higher than generation during the same period in 2015. In contrast, coal-fired electricity generation during the first 10 months of 2016 was down 12% compared with the same period in 2015.
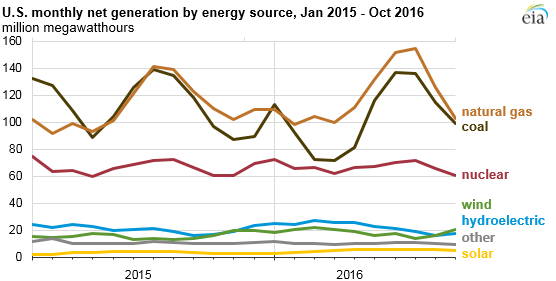
Natural gas was the primary source of U.S. electricity generation (when measured on an annual basis) in 2016 for the first time. Monthly natural gas-fired electricity generation first exceeded coal-fired generation as the primary source of electricity in April 2015. Natural gas was the leading source of electricity for nearly every month of 2016, accounting for an estimated 34% of total annual utility-scale power generation, compared with a 30% share for coal-fired generation.
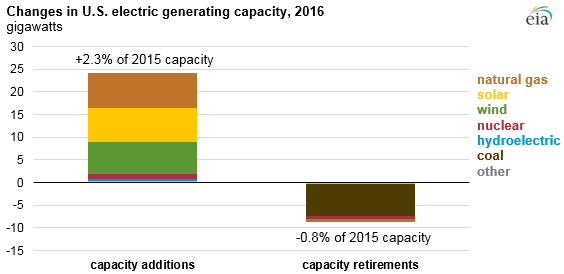
Electricity generating facilities were scheduled to add about 24 gigawatts (GW) of utility-scale capacity in 2016, more than 90% of which were natural gas, solar, and wind additions. Coal units accounted for most retirements during 2016, with more than 7 GW of coal-fired capacity retired during the year, equivalent to 2.5% of existing coal capacity in place at the end of 2015.
Principal contributor: Tyler Hodge