Hourly information on U.S. electricity supply, demand, and flows is now available
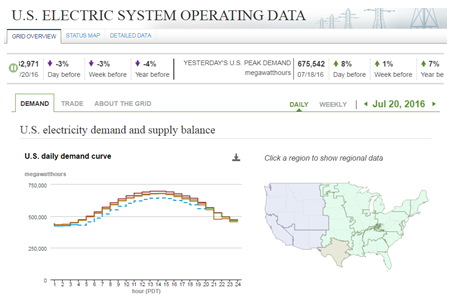
The U.S. Energy Information Administration now provides hourly electricity operating data, including actual and forecast demand, net generation, and the power flowing between electric systems. EIA's U.S. Electric System Operating Data tool provides nearly real-time demand data, plus analysis and visualizations of hourly, daily, and weekly electricity supply and demand on a national and regional level for all of the 66 electric system balancing authorities that make up the U.S. electric grid.
The information is collected directly from each interconnected electric system on the EIA-930 survey, the first hourly data collection conducted by a federal statistical agency. Although electric system balancing authorities covering most of the United States have released public, nearly real-time information on grid operations since the late 1990s, EIA's new data tool expands the availability of data to the entire contiguous 48 states, and makes it available in a consistent format from a single source.
The data are refreshed throughout the day. Among other applications, the data can be used to provide timely information on electric system recovery after power interruptions and to help evaluate the effects of renewable energy, smart grid, and demand response programs on power system operations. The data can also facilitate more informed analysis and policy decisions on a national and regional level.
Using the tool, users can visualize and analyze:
- Hourly U.S. and regional electricity demand
- The hourly flow of electricity between electric systems
- The variety in electric systems' daily demand shapes and the seasonality of daily demand patterns
- The extent to which electric systems rely on internal and external sources of supply to meet the demand for electricity
- Potential stress on electric systems when actual demand significantly exceeds forecasted demand
- The hourly flows of electricity with Canada and Mexico
Principal contributor: EIA Staff
Tags: consumption/demand, electricity