Higher renewable capacity additions in AEO2016 reflect policy changes and cost reductions
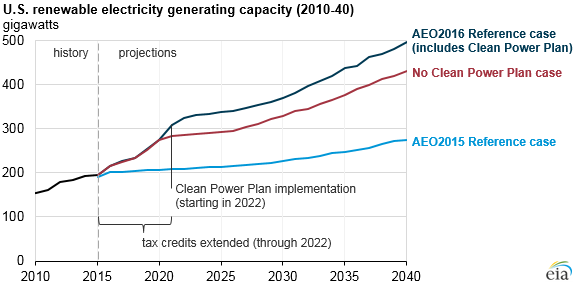
Projections for renewable electricity capacity in the U.S. Energy Information Administration's most recent Annual Energy Outlook (AEO) are significantly higher than the projections in AEO2015. The December 2015 enactment of the Consolidated Appropriations Act, 2016, which extended certain tax credits for renewable generation technologies, and the August 2015 promulgation of the U.S. Environmental Protection Agency's final Clean Power Plan (CPP) are policies that have a significant effect on projected renewables deployment. Reductions in technology costs and some changes in state policies on renewables also affect the new AEO projections. Additional AEO cases to be released later this month will show how certain policy and economic assumptions, including choices made at the state level regarding CPP implementation, affect projections for renewables deployment.
The Consolidated Appropriations Act extended tax credits for wind and solar installations. Both the investment tax credit (ITC) and the production tax credit (PTC) were extended another five years, but the value of the credits declines in the later years of the extensions.
- Investment tax credit. The ITC provides a 30% tax credit for the cost to develop solar energy projects. This credit is now extended until the end of 2019, when it will begin to decrease incrementally until 2022. In 2022 and beyond, a 10% tax credit for both utility and commercially operated solar projects will be available, while the tax credits for residential solar projects will expire in 2022. Before the extension took effect, the tax credit was set to decrease from 30% to 10%, or expire completely, depending on the sector, in 2016.
- Production tax credit. The PTC, as it relates to the generation of electricity from wind plants, provides a 2.3 cent per kilowatthour (kWh) tax credit for the first 10 years of production. This rate currently applies to plants that are under construction by the end of 2016. After 2016, the value of the tax credit for wind generation will decrease incrementally until it expires in 2020. Before the extension, the tax credit had expired at the end of 2014.
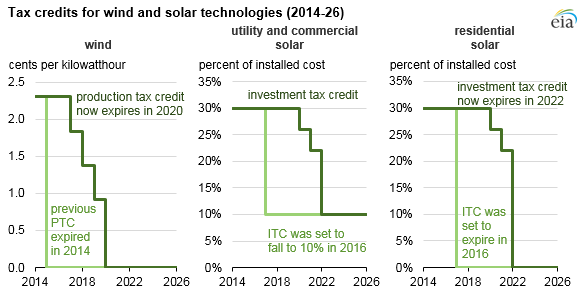
Note: The wind PTC is in 2015 dollars, while future values for the PTC will vary based on inflation. Deadlines for the solar ITC are at start-of-construction for utility/commercial projects and completion-of-construction for residential projects.
Other factors that affected projections of renewables include:
- Clean Power Plan. The Environmental Protection Agency's Clean Power Plan will also affect renewable electricity generating capacity, especially in the implementation period of 2022 through 2030. As the tax credits described above expire or become less valuable, the Clean Power Plan becomes one of the main drivers of renewable electricity generation. In addition to the AEO2016 Reference case, EIA will publish several scenarios with varying assumptions of Clean Power Plan compliance strategies, and future Today in Energy articles will address the Clean Power Plan's role in renewable electricity technology adoption.
- State policies. Targets for renewable portfolio standards (RPS) increased for a number of states in 2015, including California, Hawaii, and Vermont, but in Kansas the law was changed back to a goal rather than a mandate. Changes in other states that more recently increased or proposed increasing their RPS policies, including Oregon and New York, are not reflected in AEO2016.
- Technology costs. EIA reviewed cost and performance characteristics of electricity generating technologies for AEO2016. Capital costs for wind and solar technologies decreased compared with other technologies in the electric power sector. Costs for end-use solar technologies also declined.
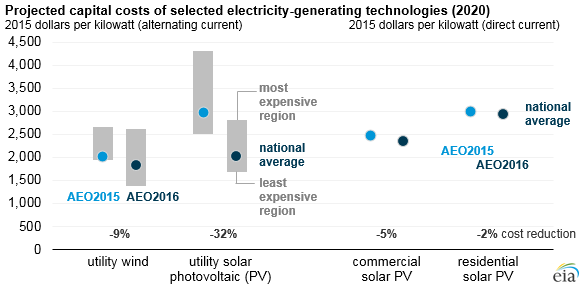
Note: Capital cost values shown before applying tax credits.
Most of the renewable growth seen in the AEO projections can be attributed to wind and solar:
- Utility wind. A total of 97% of wind capacity is in the utility sector. Wind capacity grows through 2022, but after the tax credits expire, the growth slows. When implemented, the CPP leads to more near-term builds of wind as wind developers comply early to take full advantage of the available tax credits. Once tax credits expire, however, wind deployment slows. Because the most favorable wind resources are located in a few regions in the country, increased adoption of wind technology in these regions may be limited by the ability of regional grids to handle high levels of intermittent generation.
- Utility solar. Solar competes in the utility sector and the end-use sectors as rooftop solar on residential and commercial buildings. Solar capacity in the utility sector continues to grow, but at a slower rate as the ITC decreases, starting at the end of 2019 until the credit reaches 10% in 2022. Utility solar capacity continues to grow during the CPP compliance period and through the end of the projection as costs continue to decline. In the Reference case, utility solar capacity projections nearly catch up to wind capacity projections by 2040.
- Residential and commercial solar. Projections for residential and commercial solar through 2040 are higher in AEO2016 than in AEO2015 primarily because the ITC was extended and the capital and installation cost assumptions for these solar photovoltaic systems changed. In contrast to the utility sector, the end-use sector projections are only marginally affected by the expired (or reduced) tax credits and CPP implementation.
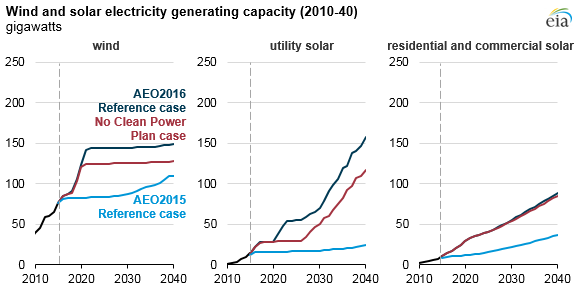
Note: Values for solar include both photovoltaic and solar thermal.
Principal contributor: Cara Marcy