Mild weather, ample natural gas supply curb Northeast winter power and natural gas prices
Wholesale natural gas and power prices in the Northeast United States remained relatively low this winter, absent the large spikes that have occurred during recent winters. A combination of increased deliveries of liquefied natural gas (LNG) into the region, a fuel adequacy winter reliability program, and the warmest winter on record helped to keep prices low and stable.
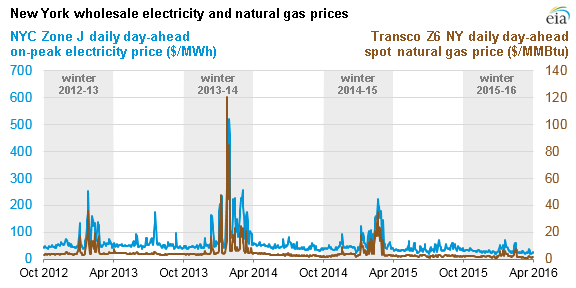
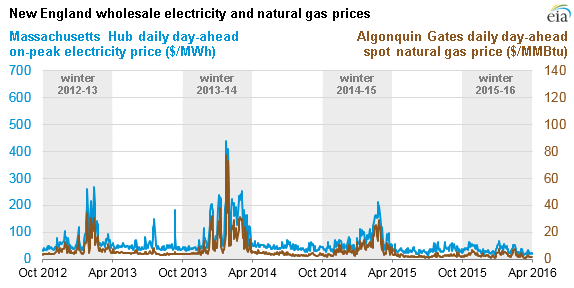
Day-ahead peak period electricity prices at the Massachusetts Hub peaked at $66 per megawatthour (MWh) this winter, down from peaks of $211/MWh during the previous winter (2014-15) and $438/MWh the winter before that (2013-14). Prices in New York City peaked at $71/MWh this winter, down from highs of $223/MWh during winter 2014-15 and $519/MWh during winter 2013-14.
Because natural gas generators often set the marginal price for electricity in the Northeast, wholesale electricity prices closely reflect wholesale natural gas prices, which were similarly low this winter. Day-ahead natural gas prices in the Boston area peaked at $7.85 per million British thermal units (MMBtu) this winter, down from peaks of $29.25/MMBtu during the previous winter (2014-15) and $77.60/MMBtu the winter before that (2013-14). Prices in New York City peaked at $7.62/MMBtu this winter, down from highs of $35.37/MMBtu during winter 2014-15 and $120.75/MMBtu during winter 2013-14.
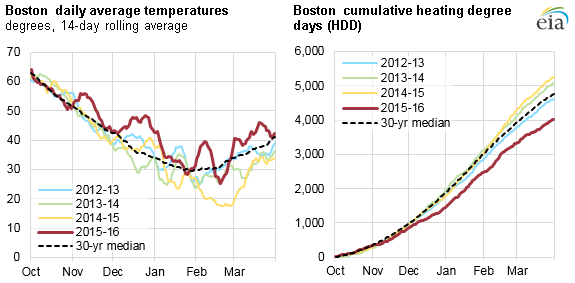
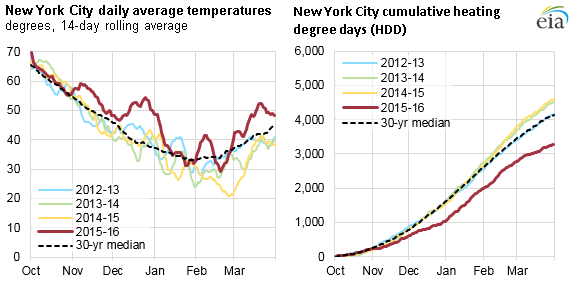
The main driver for daily changes in energy demand is the weather, and this winter was the warmest on record for the Lower 48 states. Temperatures throughout the Northeast remained well above both recent winters and the 30-year normal level throughout the winter months, which kept natural gas demand relatively low. Cumulative heating degree days (HDD) from October 2015 to March 2016 were 15% lower than the 30-year median in Boston and 21% lower than the 30-year median in New York City.
Source: U.S. Energy Information Administration, based on Bloomberg
Source: U.S. Energy Information Administration, based on Bloomberg
The price spikes seen in the Northeast in previous winters were mainly caused by natural gas supply constraints, which occurred when the natural gas volumes needed for space heating and power generation on particularly cold days exceeded the transport capacity of the natural gas pipeline network. Although some new pipeline capacity has come online in the past year to relieve bottlenecks near the region, the Northeast, particularly New England, remains constrained. Increased supplies of LNG into the area have played an important role in moderating this winter's natural gas and electricity prices.
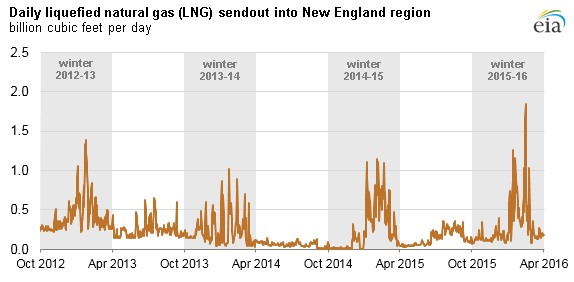
LNG sendout represents daily deliveries of natural gas onto the U.S. natural gas pipeline network from import terminals, often from onsite storage. There are several LNG import terminals outside of Boston (on land and offshore) that can feed natural gas into the pipeline system where the demand is greatest, skirting pipeline constraints between the Northeast and the rest of the country. Additionally, the Canaport LNG terminal in New Brunswick, Canada serves New England markets by bringing natural gas to the United States via the Maritimes and Northeast pipeline.
Sendout has shown flexibility in response to demand, often peaking during times of cold weather. Although much of this winter has been warmer than normal, a few cold snaps have occurred. On Sunday, February 14, for example, temperatures averaged in the teens and twenties on most of the East Coast, and LNG sendout into the New England region reached its seasonal high at 1.8 billion cubic feet per day (bcf/d). During the month of December 2015, which was much warmer than normal, total sendout averaged only 170 million cubic feet per day (MMcf/d), according to Bentek Energy and PointLogic data.
During this past winter, natural gas sendout averaged somewhat higher than the previous two winters, although the previous two winters were much colder than this winter. This higher sendout may be the result of LNG market dynamics, including relatively low LNG import prices, strong global supply, and relatively low global demand, along with procurement incentives provided by the New England Winter Reliability Program.
Introduced by the region's electric grid operator (the Independent System Operator of New England) before the 2013-2014 winter and subsequently expanded, the Winter Reliability Program provides incentives for electric generators to maintain onsite supplies of oil and secure contracts for LNG to ensure fuel adequacy during the winter months. The program also ensures that additional demand response resources are available if necessary.
Natural gas prices across the country remained at some of their lowest levels in years in 2015 because of record natural gas production and abundant amounts of natural gas in underground storage. Natural gas storage in the Lower 48 states reached 4,009 billion cubic feet (Bcf) by mid-November 2015, an all-time high. After a mild winter and lower-than-normal storage withdrawals, natural gas in storage as of March 25 totaled 2,468 Bcf, 68% higher than last year's level at this time and 52% above the five-year average.
Principal contributors: April Lee, Tim Shear, Katie Teller