As coal stockpiles at power plants rise, shippers are reducing coal railcar loadings
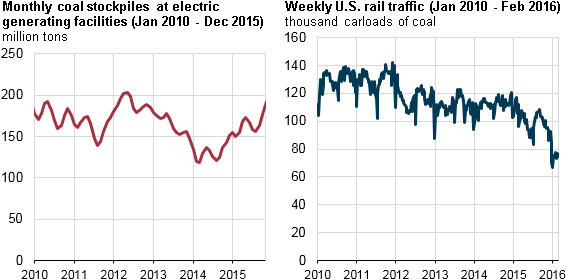
Coal stockpiles at electric generating facilities totaled 197 million tons at the end of 2015, the highest level since June 2012 and the highest year-end inventories in at least 25 years. More than 40 million tons of coal were added to stockpiles at electric generating facilities from September through December, the largest build during that timespan in at least 15 years. In addition to relatively low overall electricity generation, largely attributable to the warmest winter on record, coal-fired electricity has recently been losing market share to electricity produced using natural gas and renewable resources.
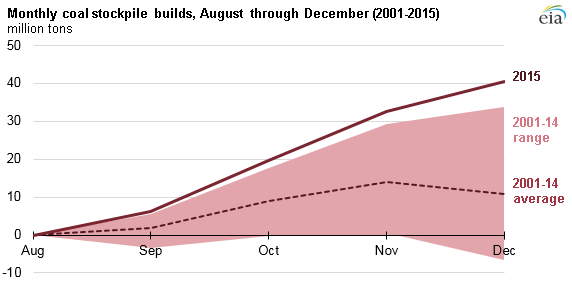
Coal stockpiles typically follow a seasonal pattern in which stocks build during the lower electricity demand periods of the spring and fall and then get drawn down during periods of higher electricity demand in the summer and winter. In 2015, the stockpile build from August to December was 40 million tons, far higher than the 11 million ton average stockpile build for these months over 2001-14. Coal stockpiles typically decrease in December, averaging a roughly 3 million ton decline for the month over 2001-14. However, stockpiles this December increased by more than 8 million tons.
As stockpiles grew toward the end of 2015, shipments of coal by rail fell. Weekly coal railcar loadings averaged nearly 94,000 carloads per week from September through December 2015, 22% below average loadings for that time of year over the previous five years. Railcar loadings were even lower in the first months of 2016. Through February, weekly coal railcar loadings averaged slightly more than 75,000 carloads, 35% below the previous five-year average.
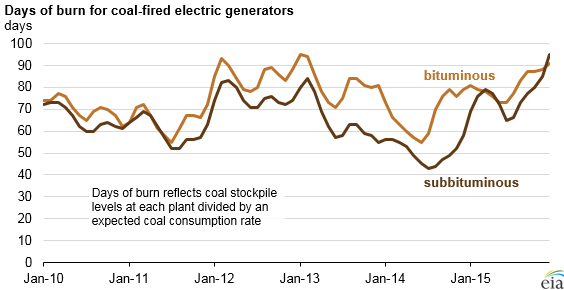
Relatively high coal stockpile levels at the end of 2015 come despite a reduction in coal-fired generation capacity. From 2010 to 2015, total U.S. coal generating capacity declined 10%, falling by nearly 33 gigawatts (GW) to 285 GW. One way of measuring coal stockpiles while accounting for the overall change in generating capacity is to calculate days of burn. This calculation considers the current stockpile level at each generator and its estimated consumption (burn) rates in coming months, based on the average consumption rates for those months over the past three years. This measure approximates how many days the generator could run at historical levels before depleting its existing stockpile.
Subbituminous coal-fired generators currently average 95 days of burn, up sharply from an annual low of 65 days in June and the highest level since 2010. Bituminous coal-fired generators currently average 91 days of burn, up from an annual low of 73 days of burn in June and the highest levels since February 2013. Subbituminous and bituminous generators make up most of the coal fleet, with 144 GW and 124 GW of capacity, respectively, at the end of 2015.
Principal contributor: Tim Shear
Tags: coal, electricity, generation, inventories/stocks, rail