Flickr page and other tools make EIA data more accessible
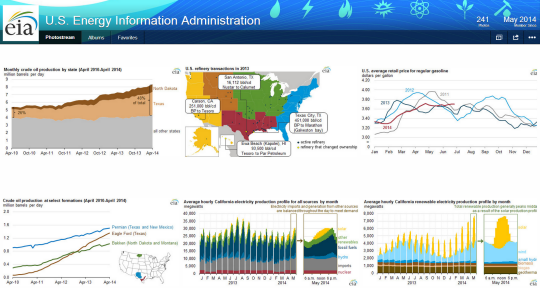
EIA's recently launched Flickr page provides users with another avenue to view graphs, charts, maps, and other images produced using EIA's data and analysis.
The images stored on EIA's Flickr page are categorized by state. This allows the public and EIA's state, tribal, county, and local stakeholders to quickly find information relating directly to their state's energy production, consumption, prices, and other energy topics covered by EIA's reports.
There are more than 240 images on the Flickr page, including many graphs and maps from Today in Energy articles. The Flickr page includes graphs and maps that illustrate dozens of important energy trends, including:
- Rising crude oil and natural gas production
- Growth in electricity generation by wind, solar, and other renewables
- Transportation bottlenecks for moving energy supplies and commodities
- Changes in energy prices
EIA's Flickr page also contains materials designed specifically for individual states, including Web banners that state agencies can use to link to their EIA state profile.
Over the past year, EIA released many tools designed to make energy information more accessible. These tools include EIA's coal data browser, electricity data browser, and application programming interface (API), to name a few.
These resources and others will be highlighted during EIA's 2014 Energy Conference. The event is being held today and tomorrow at the J.W. Marriott in Washington, DC. Readers can learn more about these resources by attending EIA's 2014 Energy Conference or reading the proceedings that will be posted after the conference.
Principal contributors: Dale Sweetnam, Tom Doggett, John Krohn
Tags: states