Effects of Changes in Natural Gas Prices and Renewable Capital Costs on the Electric Sector in Asia
Release Date: 10/14/2020 | Full report

Introduction
Asia will account for half of the world’s energy consumption by 2050 according to U.S. Energy Information Administration (EIA) projections, growing more than any other region in the world.[1] Between 2019 and 2050, electricity generation will more than double in the region, driven by economic growth and rising incomes. To meet the projected growth in electricity generation, countries in Asia will make choices about generating technology and fuel that will potentially have significant effects on global energy trade.
EIA analyzed the relationship between natural gas prices and renewable energy capital costs, and the projected electric power generation mix in China and the International Energy Outlook (IEO) region Other Non-OECD Asia[2] by running eight cases that vary natural gas prices and renewable energy technology capital costs. The analysis shows that changing natural gas prices and renewable energy capital costs can shift the electricity sector fuel mix in both regions. Although resources are generally used more when costs are relatively lower and used less when costs are relatively higher, coal use in both regions changes significantly when renewable energy capital costs and natural gas prices rise or fall in tandem because coal is the marginal fuel.
Regional dynamics also differ based on local costs and policies. For example, energy policies in China are designed to reduce coal generation in most analysis cases, focusing competition among natural gas, wind, and solar generators. In some cases, renewable energy technologies could be the predominant source of electricity generation in China by 2050. In Other Non-OECD Asia, fossil fuels remain the dominant source of electricity generation across all cases; however, renewable generators become significant sources of electricity generation in the analysis case that combines high natural gas prices with low renewable costs.
The role of natural gas in power generation in Asia
Natural gas prices and the capital costs of renewable energy are critical influences on the future power sector fuel mix, and they have potentially large implications for global natural gas production. Asia is a growing natural gas consumer. Asian countries, which generally have less accessible natural gas resources, accounted for the largest share of global liquefied natural gas (LNG) imports in 2019 (69%). Global LNG trade increased by 45% between 2015 and 2019.[3] Since 2015, between 6% and 17% of annual U.S. LNG exports went to China and Other Non-OECD Asia. In 2018, China became the world’s largest natural gas importer, with the majority of natural gas used in its industrial and power sectors.[4]
With the growth of imported natural gas, a tension exists between relying on this internationally-sourced fuel and using domestic resources, which include coal and renewable fuels such as wind and solar. To address this and other factors, some countries have developed energy diversity policies that value localized sources of electricity supply.[5] In addition, a number of countries have adopted other policies to address emissions. As a result, market costs are an important, but not the only, consideration in a region’s electricity generation mix.
Analytic Methodology
In IEO2019, EIA released a study that explored the effect of renewable capital costs on markets in Other Non-OECD Asia using the International Electricity Market Model (IEMM) component of the World Energy Projection System (WEPS). We found that, absent policy drivers, changes in renewable capital cost assumptions tended to produce proportional shifts in the generating mix.[6] In other words, markets tended not to shift in a wholesale fashion, but rather they adjusted incrementally as cost assumptions changed. This paper extends that analysis to include changes in natural gas prices and adds an additional region (China), providing a basis to compare the interaction between natural gas prices and renewable capital costs in two different regions in Asia. We analyze a series of alternative cases that vary the natural gas price and renewable capital cost assumptions across several possible combinations, and we show a wide set of potential energy market configurations.
IEO2020 is the second year of EIA’s two-year IEO development cycle. IEO2020 is based on the IEO2019 modeling platform, along with updates to the electricity supply component. These updates include new renewables targets, revised costs for certain fuel-region combinations, and updated representations of market dynamics in select regions.[7] Because IEO2020 is based on the IEO2019 modeling platform and because it focuses on long-term electricity market dynamics, it does not include the impacts of the novel coronavirus. We used this modified platform to develop the Comparative Reference case.
We developed eight additional cases to reflect higher and lower delivered natural gas prices and renewable capital costs (Table 1). All other inputs, including economic and policy assumptions, are kept constant across the cases. A combination of high and low natural gas prices and renewable costs produce nine different sets of market conditions. We ran all nine cases, as represented in the three-by-three sensitivity matrix, through integrated WEPS simulations to highlight cross-market interactions.
| Renewable capital cost | ||||
|---|---|---|---|---|
| High Cost | Nominal Cost | Low Cost | ||
| High Price | High Natural Gas Price/ High Renewable Cost |
High Natural Gas Price | High Natural Gas Price/ Low Renewable Cost |
|
| Delivered natural gas price | Normal Price | High Renewable Cost | Comparative Reference | Low Renewable Cost |
| Low Price | Low Natural Gas Price/ High Renewable Cost |
Low Natural Gas Price | Low Natural Gas Price/ Low Renewable Cost |
|
| Source: U.S. Energy Information Administration, International Energy Outlook 2020 | ||||
In the cases that include a high or low natural gas price, EIA varied the delivered natural gas price assumptions by growing or declining them to a level 50% higher or lower in 2050 for each region compared with Comparative Reference case levels, respectively (Figure 1). We selected the range of prices to approximate the highest and lowest deviation from the average cost of LNG in real terms during the past decade.
Figure 1. Natural gas price assumptions in High Natural Gas Price, Comparative Reference, and Low Natural Gas Price cases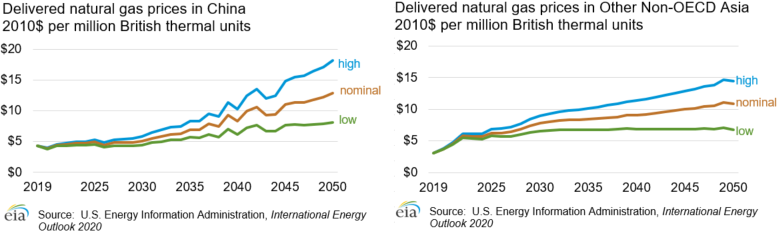
EIA develops its projections of renewable capacity in the IEMM based on existing installed capacity and load growth projections. Regionally-specific policies and targets provide a floor for renewable energy growth in any given region and year, and the IEMM projects additional renewable energy builds, if required, as part of the least-cost capacity mix needed to meet electricity demand.
The capital costs for renewable electric generation technologies incorporate learning factors—reductions in capital costs over time as a result of learning‐by‐doing.[8] In the IEMM, learning factors have two primary effects: capital costs decline over time as more installations of a specific technology are built, and capital costs of newer technologies decrease faster than more established technologies.[9] We calculate learning factors separately for generating technologies’ major design components to account for shared components among technologies.
In this analysis, to develop high and low renewable costs, EIA varied the capital costs for solar photovoltaic, wind (onshore and offshore), hydroelectric (hydro), biomass, and geothermal electric generating technologies. In the high renewable cost cases, EIA assumes capital costs do not decrease as a result of learning-by-doing and remain at 100% of their 2019 levels (Figure 2).
In the Comparative Reference case, learning factors account for capital cost declines of 8% for onshore wind and 15% for solar technologies by 2050. In the low renewable cost cases, renewable technologies have greater learning improvements, which result in 2050 capital costs that are 50% of the Comparative Reference case levels in 2050. For example, in the Comparative Reference case, by 2050, wind and solar technology costs are 92% and 85% of their 2019 levels, respectively. In the low renewable cost cases, by 2050, these costs are 46% and 43% of the Comparative Reference case levels. These learning-by-doing effects are technology specific and, in general, provide greater cost declines for newer technologies (in this case, solar).
Figure 2. Capital cost reductions in onshore wind and solar technologies across Renewable Cost cases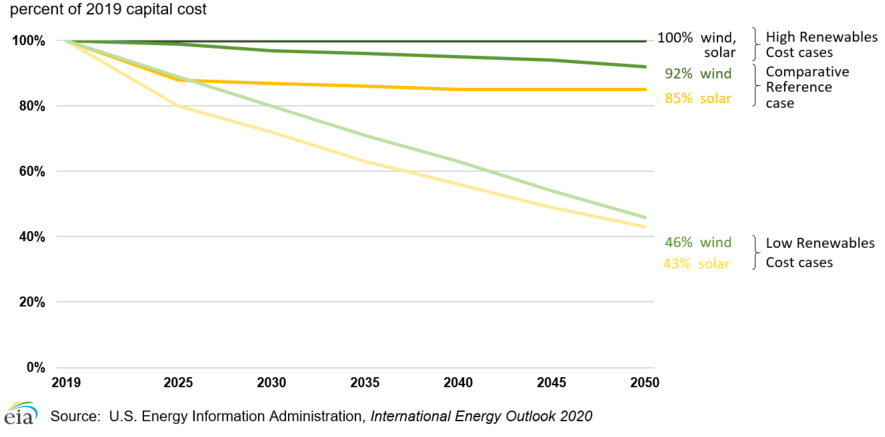
Results: China
China is the largest energy-consuming region in the world, and EIA projects that it will retain that rank through 2050. Electricity is an increasingly large portion of the country’s total energy consumption, rising from 47% of the total in 2019 to 59% in 2050. In 2019, coal was the principal fuel, providing more than half (60%) of China’s electricity generation. As part of its commitments made at the Paris Climate Change Conference (COP-21), China pledged to reach peak carbon dioxide (CO2) emissions by 2030.[10] Expanding energy use in a fast-growing economy with low-cost coal and limitations on CO2 emissions adds to the complexity of China’s energy outlook. As a result, one of the main dynamics EIA analyzes in this analysis is the competition in the electric power sector among lower-carbon sources of electricity generation, namely natural gas, wind, and solar generators (Figure 3).
Figure 3. Generation by technology in China: Comparative Reference case versus eight alternative cases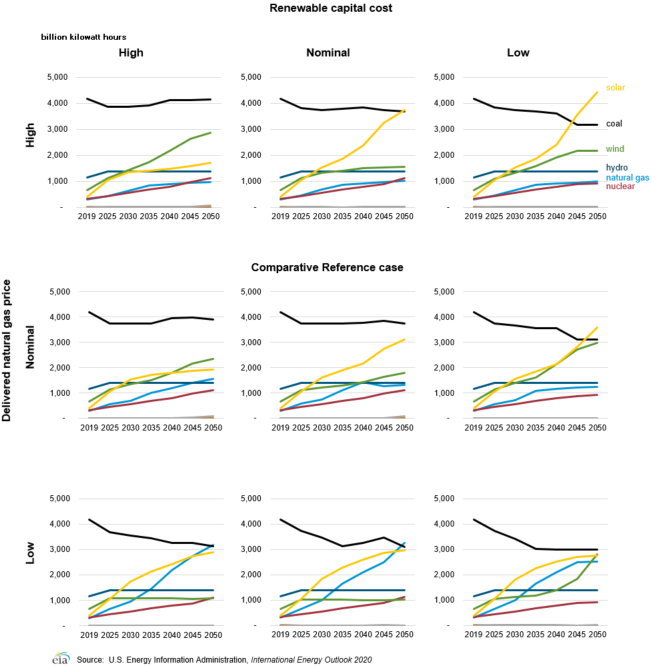
A combination of policies, low natural gas prices, and low renewable capital costs can displace coal
As a result of the economic implementation of emission policies in China in IEMM, coal use, in part, is sensitive to economic competition with other competitive sources of electricity generation. In the case with the lowest natural gas and renewables prices (for example, the Low Natural Gas Price with Low Renewable Cost case), coal generation decreases to its lowest 2050 level across all cases at 2,986 billion kilowatthours (kWh), 20% lower than Comparative Reference case levels (3,752 billion kWh). By contrast, the aggregate generation from wind, solar, and natural gas in this case rises 31% from the Comparative Reference case projected levels (6,209 billion kWh) to 8,105 billion kWh in 2050.
Low natural gas prices suppress growth in other sources
Natural gas price is the main driver of changes in natural gas generation, and natural gas generation is relatively insensitive to changes in renewable costs. In the Comparative Reference case, natural gas generation gradually increases in the near term, before leveling off in 2040, with an annual growth rate of 4.9% from 2019 to 2050. Regardless of renewable costs, the annual growth rate of natural gas generation, in the six cases with reference and high natural gas prices, stays relatively similar to the Comparative Reference case, ranging from 3.9% to 5.5% from 2019 to 2050. In the low natural gas price cases, the annual growth of natural gas generation increases to a range of 7.2% to 8.1% during the same period. With natural gas generation more economically attractive in these cases, low natural gas prices suppress additional renewable generation, unless renewable costs are also low.
Some cases show solar generation as a predominant source of renewable generation in 2050
Solar and wind technologies are economically competitive in the Comparative Reference case, where the combined share of wind and solar in the generation mix surpasses coal by 2050. Lowering their costs from Comparative Reference case levels generally amplifies this trend. Across the low renewable cost cases, solar and wind combined provide as much as half of the electricity generation by 2050.[11] Although low natural gas prices suppress additional penetration of renewables, a combination of low natural gas prices and low renewable costs drives down coal’s share of the generation mix to 22% by 2050 in the Low Renewable Cost and Low Natural Gas Price case, down from 30% in the Comparative Reference case. With natural gas prices at either reference or high levels, solar generation grows when renewable energy capital costs are low and becomes the predominant source of electricity generation in 2050. In the High Natural Gas Price and Low Renewable Cost case, solar generation grows at 8.2% per year from 2019 to 2050, reaching 4,443 billion kWh by 2050 (an increase of 43% over the Comparative Reference case level of 3,101 billion kWh).
High renewable costs favor wind over solar
Under the high renewable cost assumptions, solar is disproportionately disadvantaged because it does not experience the deeper learning-by-doing cost reductions it would have otherwise experienced because it is a relatively newer technology than wind. As such, wind generation increases more than solar in the high renewable cost cases relative to the other cases, except when natural gas prices are low, which generally suppresses growth of renewables. With high natural gas prices and high renewables costs, solar capital costs are disproportionately high, and in the High Natural Gas Price and High Renewable Cost case, wind generation increases to 2,858 billion kWh by 2050, up 60% from the 2050 Comparative Reference case wind generation level (1,791 billion kWh).
Results: Other Non-OECD Asia
Similar to China, coal is the predominant fuel used for electricity generation in Other Non-OECD Asia. Natural gas and hydro, however, are also significant contributors to the current generation mix. In this region, without a single overriding emissions policy, the analysis shows a three-way competition between coal, natural gas, and renewables (Figure 4).
Figure 4. Generation by fuel in Other Non-OECD Asia: Comparative Reference case versus eight alternative cases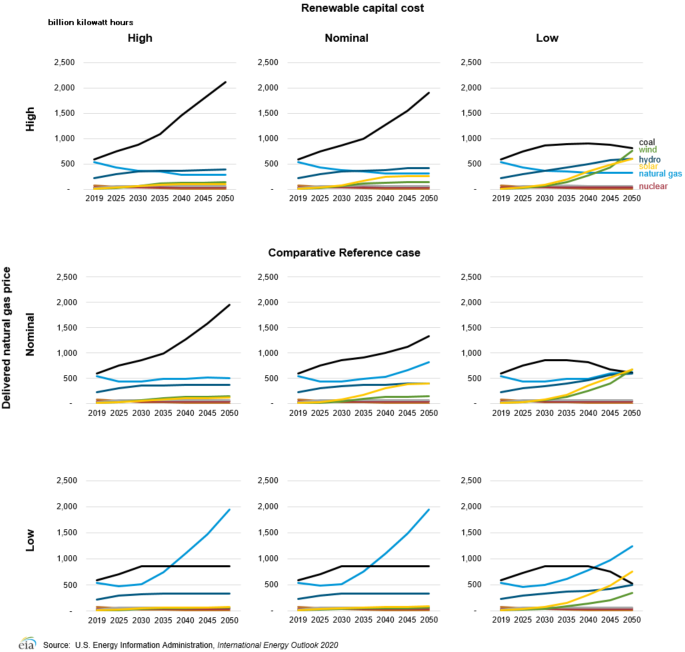
Because of its abundance and accessibility, coal-fired generation grows through 2050 in cases without lower natural gas prices or renewable technology costs
Coal is a common fuel source in Other Non-OECD Asia, accounting for 42% of the 2050 generation mix in the Comparative Reference case. Lower natural gas prices and renewable energy capital costs, however, make these sources increasingly competitive with coal. In the Low Natural Gas Price and Low Renewable Cost case, coal generation declines to 15% of the 2050 generation mix.
Unlike in China, natural gas generation varies widely across the cases
In the Comparative Reference case, natural gas is this region’s second-largest source of electricity, accounting for 26% of the generation mix in 2050. Without a unitary emissions policy and with closer natural gas and coal fuel prices than in China, natural gas generation patterns in this region vary more across analysis cases. In the low natural gas price cases, the 2050 share of electricity generation from natural gas generators ranges from 36% to 58%, making it the predominant fuel for electricity use. Natural gas generation is highest across all cases in the Low Natural Gas Price case, achieving 1,954 billion kWh in 2050, 239% higher than the Comparative Reference case levels of 818 billion kWh.
By contrast, in the High Natural Gas Price and High Renewable Cost case, 2050 natural gas generation reaches its lowest level across all cases at 283 billion kWh, down 65% from the Comparative Reference case. In all high natural gas price cases, natural gas generation steadily declines throughout the projection period, and higher levels of coal generation generally displace it, except when renewable costs are low. In the High Natural Gas Price and Low Renewable Cost case, the combined share of solar, wind, and hydro generation in 2050 more than doubles from the Comparative Reference case, accounting for 61% of the generation mix versus 29% in the Comparative Reference case.
Low renewable capital costs make solar, wind, and hydro economically competitive, driving declines in coal generation
Similar to China, when natural gas prices in Other Non-OECD Asia are low, renewable energy capital costs must also be low for renewables technologies to be competitive. Because cheap solar resources are available in this region (for example, in Indonesia, its most populous country), incremental generation from this renewable technology is generally favored over wind, especially when low natural gas prices render natural gas a competitive source of generation.[12] Unlike China, Other Non-OECD Asia relies on its hydro resources to help balance wind and solar generation since new hydro development in the region is relatively economical. Although these three renewable technologies are economically attractive and generally have greater penetration in the low renewable cost cases, their growth rates begin to slow later in the projection period as each technology exhausts its most economically favorable resource potential and possibly incurs higher grid expansion costs as resource development occurs further from demand centers.
Conclusions
Natural gas prices and renewable energy capital costs affect the electricity generation mix in Asia in ways that depend on market factors, policies, and resource endowments in the region. Although changing natural gas prices and renewable costs generally produce proportional shifts in the electricity sector’s fuel mix, regionally-specific fuel dynamics and resource availability are also important factors.
In China, the country’s energy policies limit growth in coal-fired generation, which can be further affected by changes in renewables cost assumptions and natural gas prices. Decreases in natural gas prices produce the largest changes in the generation mix. Natural gas is relatively insensitive to changes in renewable costs in China, and the largest driver of natural gas generation remains natural gas fuel prices. Solar could become the predominant source of electricity generation by 2050 if renewable costs are low and natural gas prices are high or at the reference level.
In Other Non-OECD Asia, the main dynamic driving the region’s generation mix is a three-way competition between coal, natural gas, and renewable technologies. Without a unitary emissions policy in this region, natural gas and renewables are only economically competitive with coal generation when their respective fuel prices and capital costs are low. Decreasing natural gas fuel prices by 50% by 2050 makes natural gas the primary fuel for electricity generation in the region. Conversely, raising natural gas fuel prices, particularly when combined with lowered renewable capital costs, raises the aggregate generation share of solar, wind, and hydro technologies to 61%, more than double the Comparative Reference case levels (29%). Solar resources are generally the most economically competitive and available renewable technology in this region. Unlike China, however, this region can develop economically attractive hydro resources to help balance intermittent generation produced from wind and solar technologies.
The results of the IEO2020 alternative cases in these two regions indicate a wide range of possible outcomes for the electric generation mix, and these outcomes could significantly affect the pattern of world energy trade in different ways, depending on natural gas prices and renewable technology costs.
Appendix A. IEO Regions
Figure A1. IEO Regions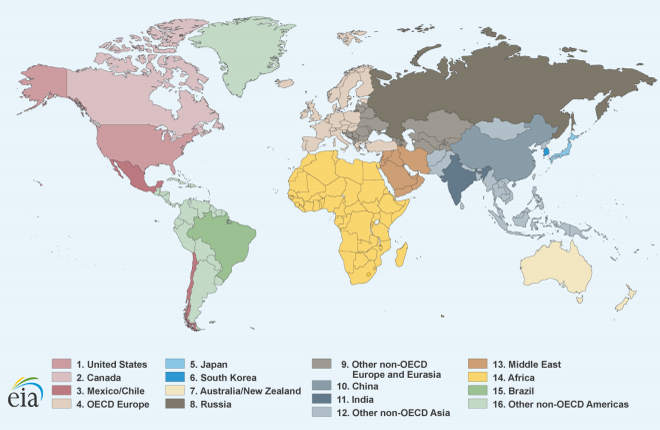
Source: U.S. Energy Information Administration, International Energy Outlook 2019 (https://www.eia.gov/outlooks/ieo/pdf/appm.pdf)
Back to topEndnotes
- IEO2019 Reference case, EIA
- Other Non-OECD Asia includes countries in Asia that are not members of the Organization for Economic Cooperation and Development (OECD) other than China, Russia, and India, including Indonesia, Thailand, Vietnam, Malaysia, etc. Full regional definitions used in the International Energy Outlook appear in Appendix A.
- The growth was led primarily by capacity additions in Australia, the United States, and Russia, which combined account for more than 90% of the global growth in liquefaction capacity.
- Natural Gas Weekly Update, EIA, 4/23/20.
- ASEAN Plan Of Action For Energy Cooperation (APAEC) 2016-2025.2015.
- Effects of renewable technology capital costs on electricity capacity and generation in two illustrative regions. IEO2019. EIA.
- EIA’s international modeling system, WEPS, for IEO2020 also includes a simplified representation of the Global Hydrocarbon Supply Module (GHySMo). For the IEO2020 Issue in Focus analyses discussing Asia and India, all cases also include an updated representation of Africa’s geography to reflect two sub-regions within IEMM.
- Similar to the methodology used for the National Energy Modeling System (NEMS) Electricity Market Module. For a more detailed description, see U.S. Energy Information Administration, NEMS Component Design Report Modeling Technology Penetration (Washington, DC, March 1993).
- Learning factors do not directly correlate to the reductions in cost (in other words, a 4% reduction in learning-by-doing is typically not equivalent to a 4% increase in cost). Changes in learning factors may not produce linear changes in costs.
- China has committed to “achieve the peaking of carbon dioxide emissions around 2030 and making best efforts to peak early.” In IEMM, the policy is implemented as price incentives to achieve peak coal generation by 2030, without a specific CO2 emission cap.
- Wind and solar’s combined share of the 2050 generation mix increases from 39% in the Comparative Reference case to a range spanning 42% to 51% across the three low renewable cost cases.
- Similar to the results in China, solar is disproportionately disadvantaged in the High Renewable Cost cases because it does not get the steeper learning-by-doing cost declines it would have otherwise been subject to as a newer technology.