Production lookback 2013
Released: January 16, 2014
U.S. natural gas production increases by 1% in 2013
Average dry natural gas production grew modestly in 2013, despite a 35% year-on-year rise in prices. Production grew from 65.7 billion cubic feet per day (Bcf/d) in 2012 to 66.5 Bcf/d in 2013, a 1% increase and the lowest annual growth since 2005. This production growth was essentially flat when compared to the 5% growth in 2012 and the 7% growth in 2011.
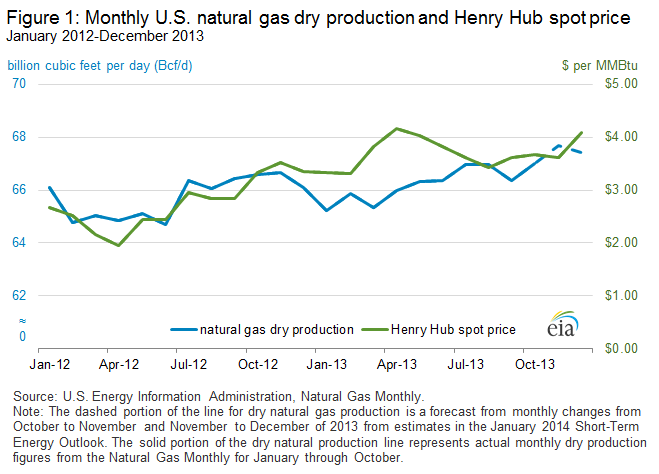
Average wholesale (spot) prices for natural gas in 2013 increased significantly throughout the United States compared to 2012. The average wholesale price for natural gas at Henry Hub in Erath, Louisiana, a key benchmark location for pricing throughout the United States, rose to $3.73 per million British thermal units (MMBtu) in 2013. However, 2013 prices were, with the exception of 2012, at their lowest level since 2002.
Slower demand growth, low imports limit room for gas production growthAlthough prices remained relatively low, total disposition (consumption, gross exports, and net storage injections) of natural gas was flat in 2013 compared with 2012 levels, versus the annual 3% increase in 2012, and the 4% increase in 2011. Domestic consumption in 2013, which makes up 96% of total U.S. natural gas disposition, increased by 2%, despite the decrease in consumption of natural gas for electric generation (power burn) in 2013. Natural gas consumed for power burn was 2.6 Bcf/d below 2012 levels as coal regained some of its market share in response to higher natural gas prices, compared with coal, and as cooler summer temperatures in 2013 reduced total electric generation demand. Increased winter natural gas demand offset the decline in power burn, leading to a net increase in consumption for the year.
Since 2010, domestic production has satisfied 88% of U.S. natural gas disposition, as natural gas imports to the United States have continued to decline. As recently as 2007, the United States depended on imports for 16% of its natural gas needs. Although U.S. production has displaced some natural gas imports to the United States, imports continue, although as a marginal source of supply, largely during cold weather and pipeline maintenance outages.
Storage injections provided another outlet for U.S. natural gas production growth. The net withdrawal in working natural gas storage inventories in 2013 was significantly higher than 2012 because of large withdrawals in January and December. High demand at the end of the year offset the effect of end-of-October working gas inventories that had reached their third-highest level in the past 10 years. By the end of December, inventories had declined to their seventh-highest level in the past 10 years. The net withdrawal in inventories in 2013 was 537 billion cubic feet (Bcf), significantly greater than the net withdrawal of 49 Bcf in 2012. In 2011, there was a net injection into working inventories of 351 Bcf.
Growth in Marcellus Shale production offsets decreases in other basinsGreater levels of natural gas output in the Marcellus Shale contributed to the net increase in national production levels despite decreases in other basins. Dry natural gas production from Marcellus rose by 61%, from a 2012 average of 6.5 Bcf/d to a 2013 average of 10.4 Bcf/d (Figure 2), according to U.S. Energy Information Administration (EIA) calculations based on data from Drillinginfo. Marcellus production alone accounted for 75% of all production growth over the past year in the six basins covered in EIA's recently released Drilling Productivity Report (DPR), which highlights the latest regional trends in drilling, completion, and production from gas- and oil-producing wells.
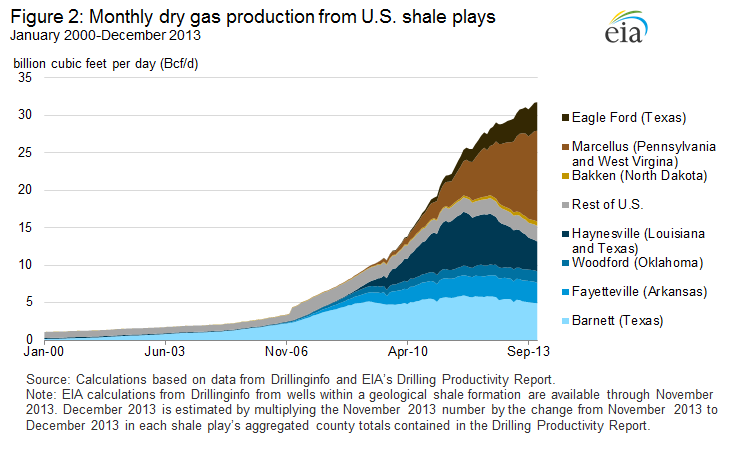
Despite a 21% decline from 2012 to 2013 in the total rig count in the Marcellus, natural gas output per rig rose by 47%, according to the DPR. Production gains have come largely from northeastern portions of the basin producing drier natural gas, where output has benefitted from gathering line and pipeline capacity expansions. However, infrastructure improvements have also bolstered production in the wetter southwestern portions of the basin, which saw increased drilling in 2013.
Outside of Marcellus, the shift toward liquids-rich production continued in 2013Wide differences in natural gas and oil prices affect the decisions that upstream operators make about where and how to deploy capital. Although natural gas prices remained at relatively low levels through the end of 2013, crude oil prices remained mostly above $100/barrel (bbl), encouraging operators to target regions with wetter gas and higher returns on investment.
The Haynesville Shale in Texas and Louisiana and the Barnett Shale in Texas generally are considered dry natural gas plays because of the low level of liquids in their production streams. Production from the Haynesville and Barnett declined by 27% and 9%, respectively, between 2013 and 2012. The Barnett and Haynesville reductions exceeded the 3% combined increase in gas production at the Fayetteville Shale in Arkansas and the nearby Woodford Shale in Oklahoma. The Baker Hughes active rig count decreased significantly in all four of these basins between 2011 and 2013. Some of the production declines in these fields are also partially attributable to the normal decline or maturity of their existing wells.
At the same time, increased new production activity in wetter shale basins enabled these basins to pick up some of the drop-off in production from their drier counterparts. At the Eagle Ford in south Texas, where operators target a combination of crude oil, condensate, and natural gas liquids, average daily gas production reached 3.3 Bcf/d in 2013, 54% higher than in 2012. In 2012, the average active rig count in Eagle Ford rose by 29% before declining slightly in 2013. Production also grew by 33% in the Bakken Shale in North Dakota and Montana, where operators predominantly target crude oil, following a rig count increase in 2012.
The shift in new production activity from drier to wetter production fields is demonstrated by data on Lower 48 gross withdrawals from wells producing only natural gas, versus those producing a combination of gas and oil. While gross withdrawals from wells containing only natural gas rose by 4% from 2011 to 2013, from 40.4 Bcf/d to 42.1 Bcf/d, gross withdrawals from wells producing a combination of both gas and oil increased by 7%, from 25.0 Bcf/d to 26.8 Bcf/d (Figure 3), according to EIA calculations with data from Drillinginfo.
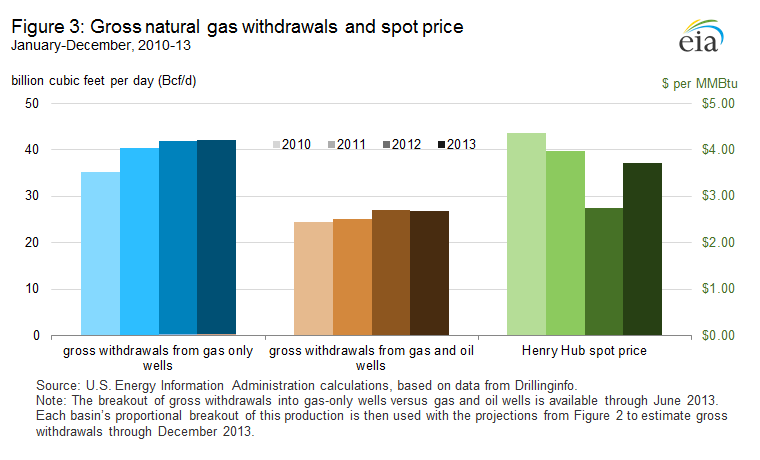
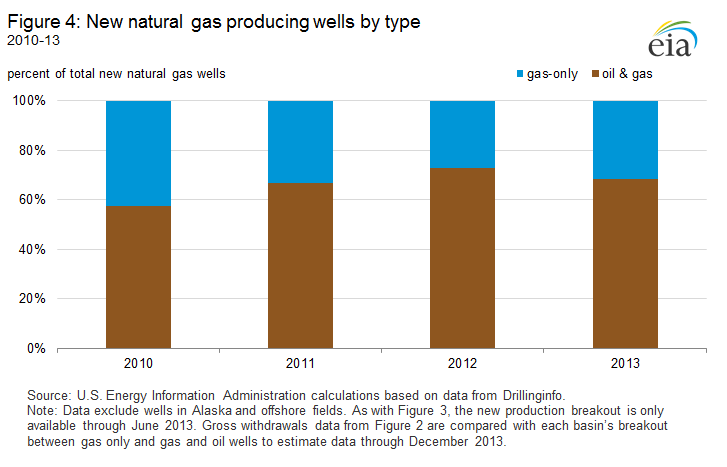
The increased gross withdrawals from wells producing both gas and oil coincided with changes in the oil-to-natural gas price ratio. When the oil-to-natural gas price ratio increased by 49% in 2012, from $28.33/bbl of Brent crude oil in 2011 to $42.13/bbl of Brent crude oil for every $1.00/MMBtu of natural gas, gross withdrawals from wells producing both gas and oil rose by 8%. When gas prices rose and the oil-to-gas price ratio decreased by 30% to $29.61/bbl of Brent crude oil for every $1.00/MMBtu of natural gas in 2013, gross withdrawals from wells producing both gas and oil decreased by 1%. The shift in the focus of new natural gas production activity was also evident in terms of the increase since 2010 in the percentage of new wells that produced both natural gas and oil (Figure 4). In 2010, 57% of all new natural gas-producing wells produced both gas and oil. By 2012, 73% of all new natural gas producing wells produced both gas and oil. This share fell to 68% in 2013.
The shift in natural gas production also involved movement away from geologically more permeable zones that have traditionally accounted for a greater share of North American gas supply. Marketed natural gas production was generally flat or down for inland production areas outside of shale and tight formations in 2012 and 2013, except for New Mexico, and also remained relatively flat in onshore Canada. Production from offshore areas in both Canada and the United States declined between 2012 and 2013 (Table 1).
| State/province/region* | Measure | 2011 Bcf/d | 2012 Bcf/d | 2013, Jan-Oct Bcf/d | % change, 2012-2013 |
|---|---|---|---|---|---|
| Wyoming | marketed | 5.9 | 5.5 | 5.2 | -6% |
| New Mexico | marketed | 3.4 | 3.3 | 3.4 | 3% |
| Federal Offshore Gulf of Mexico | marketed | 5.0 | 4.1 | 3.6 | -12% |
| Alberta | dry** | 10.4 | 9.8 | 9.8 | 0% |
| British Columbia and Saskatchewan (combined) | dry** | 3.9 | 3.9 | 4.0 | 4% |
| Sable Island | gross*** | 0.3 | 0.2 | 0.1 | -32% |
*Wyoming, New Mexico, and federal Gulf of Mexico production data from EIA's Natural Gas Monthly report. Alberta, British Columbia, and Saskatchewan production data from Canada's National Energy Board. Sable Island offshore production data from the Canada-Nova Scotia Offshore Petroleum Board. |
|||||
Data series
U.S. consumption, production, storage, imports, and exports data for 2013 used in this report are a combination of data published in EIA's Natural Gas Monthly (January-October) and data published in EIA's Short-Term Energy Outlook (November-December).
Production terms and definitions
- Depending on data availability, different natural gas-related production data were used in this article. Whenever possible, data for dry natural gas, which is consumer-grade natural gas, were used.
- Because the U.S. Energy Information Administration (EIA) data do not specify dry natural gas production from gas-only versus gas-and-oil wells in each basin, gross withdrawals were used, based on EIA calculations using data from Drillinginfo. Gross withdrawals is a broader measure than dry production in terms of what is extracted from a gas-producing well. It includes gas that is later vented or flared, gas that is used for well repressuring, nonhydrocarbon gas removed at processing plants, and lighter liquids recovered at processing plants such as ethane, propane, and butane.
- Additionally, because EIA does not provide dry production on a state-by-state basis, marketed production was used when discussing gas produced in individual states. This is also a broader measure of what is extracted from wells than dry production, in that it includes lighter liquids recovered from processing plants. However, it is a more specific measure than gross withdrawals.
- Marketable production and raw gas are official metrics available for gas produced in Canada. According to Canada's National Energy Board, marketable production is comparable to what EIA describes as dry production, while raw gas is comparable to EIA's definition for gross withdrawals.