U.S. Energy Information Administration logo
Skip to sub-navigation

Energy & Financial Markets

What drives petroleum product prices?

An analysis of key factors influencing petroleum product markets

Skip to page content

What drives petroleum product prices: Trade

The global trade of petroleum products facilitates efficient flows of fuels to regions short on supply. These flows mitigate price spikes, encouraging prices in different regions of the world to generally move together.

However, disruptions to trade flows increase the risk of supply shortages and can cause price spikes. For example, in 2022, petroleum product prices rose in response to the various sanctions the United States and many U.S. allies, particularly in Europe, announced against Russia’s petroleum industry following its full-scale invasion of Ukraine. Diesel prices in particular increased sharply because about half of Europe’s diesel imports came from Russia prior to the sanctions, leaving European countries scrambling to find alternative sources, often from more distant regions. Although the United States only imported small volumes of distillate fuel oil from Russia, the resulting tightness in Europe encouraged increased U.S. exports, tightening supply and raising prices. As markets adjusted to new trade routes, the effects on prices subsided.
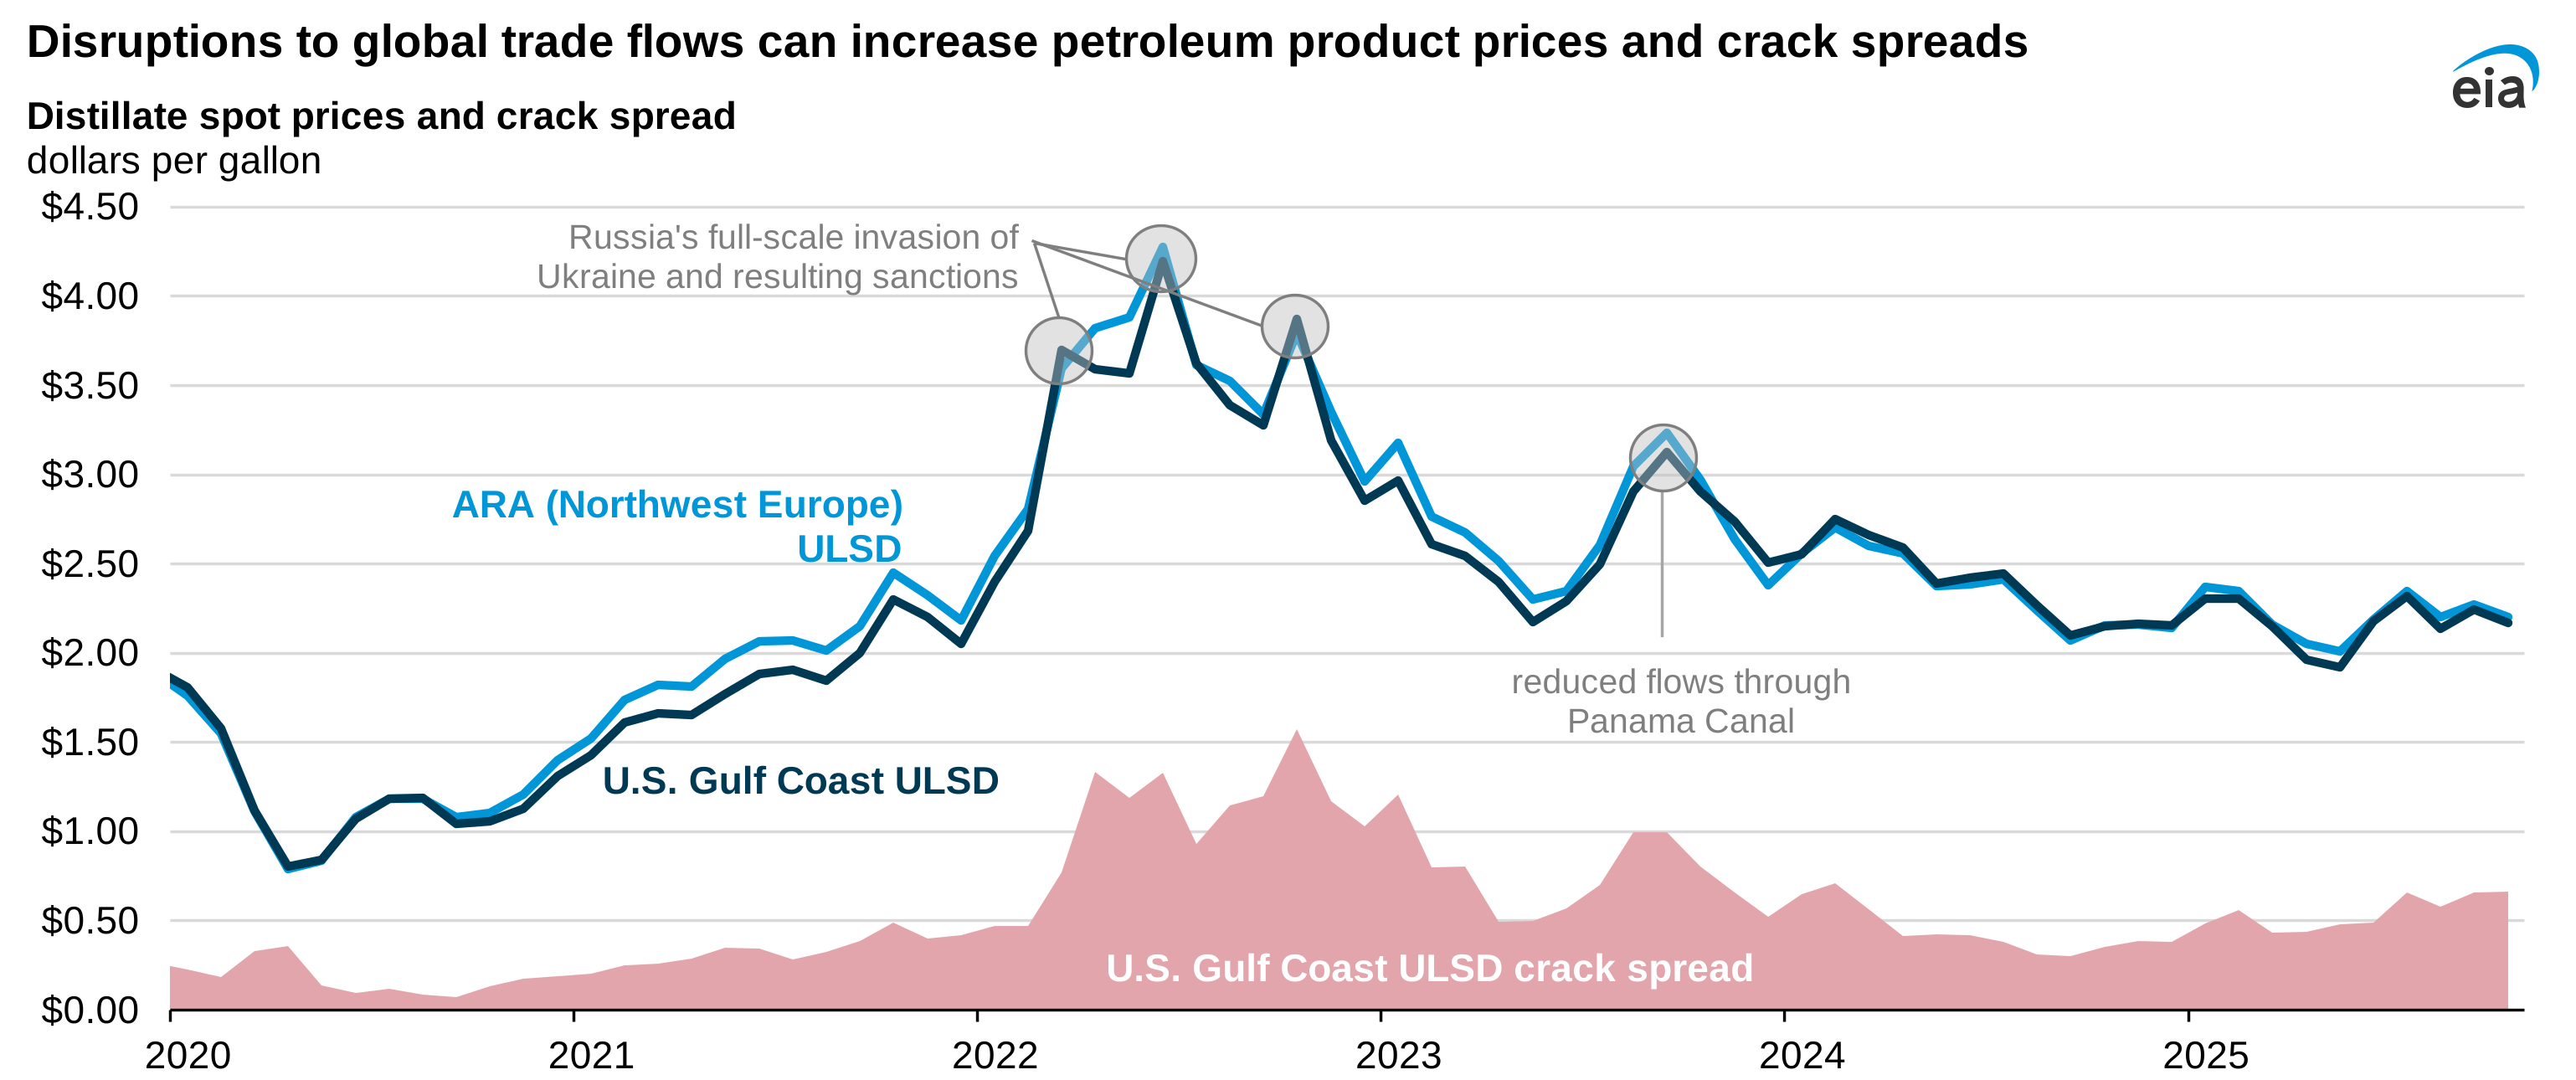
Disruptions to global trade flows can increase petroleum product prices and crack spreads

Data source: Bloomberg, L.P., U.S. Energy Information Administration
Note: ULSD = ultra-low sulfur diesel. Real prices are adjusted to July 2025 dollars.

Disruptions to trade flows are sometimes related to reduced marine vessel traffic through global oil transit chokepoints—narrow sea lanes vital for global oil transport&mdahs;like the Panama Canal and the Strait of Hormuz. International energy markets depend on reliable transport routes. The inability of oil to transit a major chokepoint, even temporarily, can lead to substantial supply delays and higher shipping costs, resulting in higher prices for petroleum and petroleum products. For example, in 2023, a drought limited traffic through the Panama Canal, increasing shipping costs for many commodities, including petroleum products.

Statistics
Analysis
Tools
Education
News

Petroleum & Other Liquids

Crude oil, gasoline, heating oil, diesel, propane, and other liquids including biofuels and natural gas liquids.

Natural Gas

Exploration and reserves, storage, imports and exports, production, prices, sales.

Electricity

Sales, revenue and prices, power plants, fuel use, stocks, generation, trade, demand & emissions.

Coal

Reserves, production, prices, employment and productivity, distribution, stocks, imports and exports.

Nuclear & Uranium

Uranium fuel, nuclear reactors, generation, spent fuel.

Renewable & Alternative Fuels

Includes hydropower, solar, wind, geothermal, biomass and ethanol.

EIA Survey Forms

Forms EIA uses to collect energy data including descriptions, links to survey instructions, and additional information.

Total Energy

Comprehensive data summaries, comparisons, analysis, and projections integrated across all energy sources.

U.S. States

State energy information, including overviews, rankings, data, and analyses.

International

International energy information, including overviews, rankings, data, and analyses.

Environment

Greenhouse gas data, voluntary reporting, electric power plant emissions.

Data Tools, Apps, & Maps

Tools to customize searches, view specific data sets, study detailed documentation, and access time-series data.

Open Data

EIA's free and open data available as API, Excel add-in, bulk files, and widgets

EIA Beta

Come test out some of the products still in development and let us know what you think!

Open Source Code

EIA's open source code, available on GitHub.

RSS Feeds

Subscribe to feeds for updates on EIA products including Today in Energy and What's New.