Menu
Crude oil, gasoline, heating oil, diesel, propane, and other liquids including biofuels and natural gas liquids.
Exploration and reserves, storage, imports and exports, production, prices, sales.
Sales, revenue and prices, power plants, fuel use, stocks, generation, trade, demand & emissions.
Energy use in homes, commercial buildings, manufacturing, and transportation.
Reserves, production, prices, employment and productivity, distribution, stocks, imports and exports.
Includes hydropower, solar, wind, geothermal, biomass and ethanol.
Uranium fuel, nuclear reactors, generation, spent fuel.
Comprehensive data summaries, comparisons, analysis, and projections integrated across all energy sources.
Monthly and yearly energy forecasts, analysis of energy topics, financial analysis, congressional reports.
Financial market analysis and financial data for major energy companies.
Greenhouse gas data, voluntary reporting, electric power plant emissions.
Maps, tools, and resources related to energy disruptions and infrastructure.
State energy information, including overviews, rankings, data, and analyses.
Maps by energy source and topic, includes forecast maps.
International energy information, including overviews, rankings, data, and analyses.
Regional energy information including dashboards, maps, data, and analyses.
Tools to customize searches, view specific data sets, study detailed documentation, and access time-series data.
EIA's free and open data available as API, Excel add-in, bulk files, and widgets
Come test out some of the products still in development and let us know what you think!
EIA's open source code, available on GitHub.
Forms EIA uses to collect energy data including descriptions, links to survey instructions, and additional information.
Sign up for email subscriptions to receive messages about specific EIA products
Subscribe to feeds for updates on EIA products including Today in Energy and What's New.
Short, timely articles with graphics on energy, facts, issues, and trends.
Lesson plans, science fair experiments, field trips, teacher guide, and career corner.
EIA is continuing normal publication schedules and data collection until further notice.
Graphs & data updated monthly and quarterly
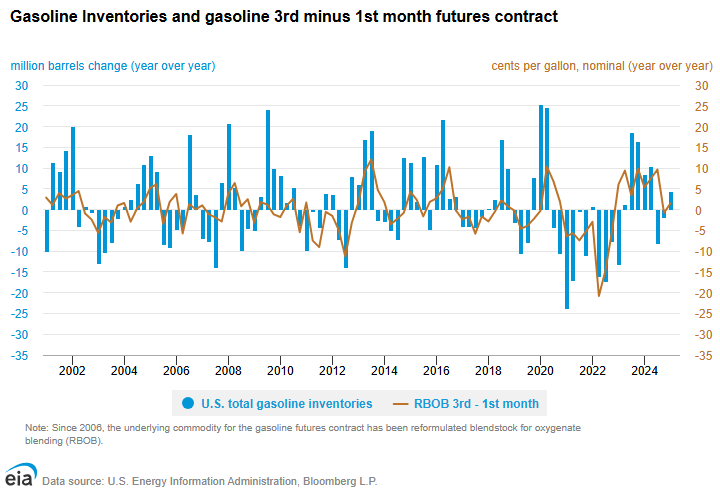
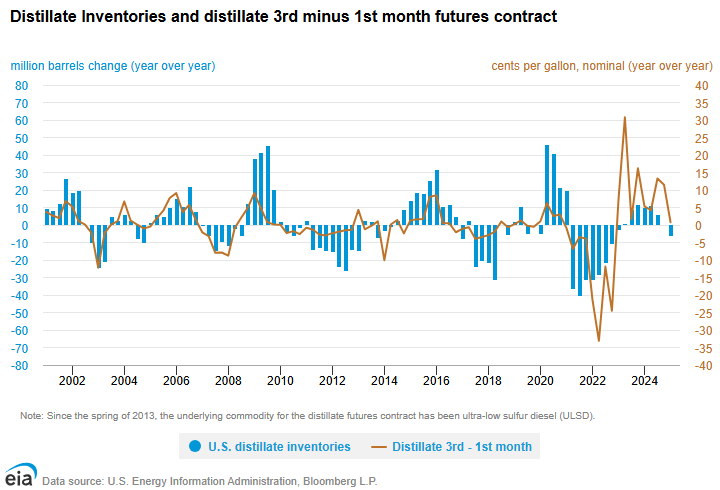
The seasonal consumption pattern of gasoline, with higher demand in the summer than in the winter, affects inventory management by refiners and end users. In the summer driving season, gasoline inventories tend to decline whereas in the fall and winter, gasoline inventories are replenished. Distillate inventories also exhibit seasonality based on distillate's use as a heating fuel in the winter months, although this effect has declined in recent years as distillate is increasingly used as a low-sulfur transportation fuel. In areas of the United States, such as the Northeast, where distillate is still widely used for heating, inventories display a more pronounced seasonal pattern of decreasing in the winter time and increasing in the summer.
Because inventories can satisfy either current or future demand, their level is sensitive to the relationship between the current product prices and expectations of future prices. If market expectations indicate a change toward relatively stronger future demand or lower future supply, prices for futures contracts will tend to increase, encouraging inventory builds to satisfy the otherwise tightening future balance. On the other hand, a sharp loss of current production or unexpected increase in current consumption will tend to push up spot prices relative to futures prices and encourage inventory drawdowns to meet the current demand. The futures curve for gasoline, for example, exhibits the seasonality inherent to the product's consumption. Prices for summer months are higher, which encourages inventory builds in the transition months between seasons to satisfy future demand.