2012 Commercial Buildings Energy Consumption Survey: Water Consumption in Large Buildings Summary
CBECS 2012 - Release date: February 9, 2017
Using water consumption data from the Commercial Buildings Energy Consumption Survey (CBECS), EIA estimates that the 46,000 [1] large commercial buildings (greater than 200,000 square feet) used about 359 billion gallons of water (980 million gallons per day) in 2012. This level represents an estimated 2.3% of the total public water supply in the United States [2]. On average, these buildings used 7.9 million gallons per building, 20 gallons per square foot, and 18,400 gallons per worker in 2012. On a daily basis, they used an average of 22,000 gallons per building, 55.6 gallons per thousand square feet, and 50.1 gallons per worker.
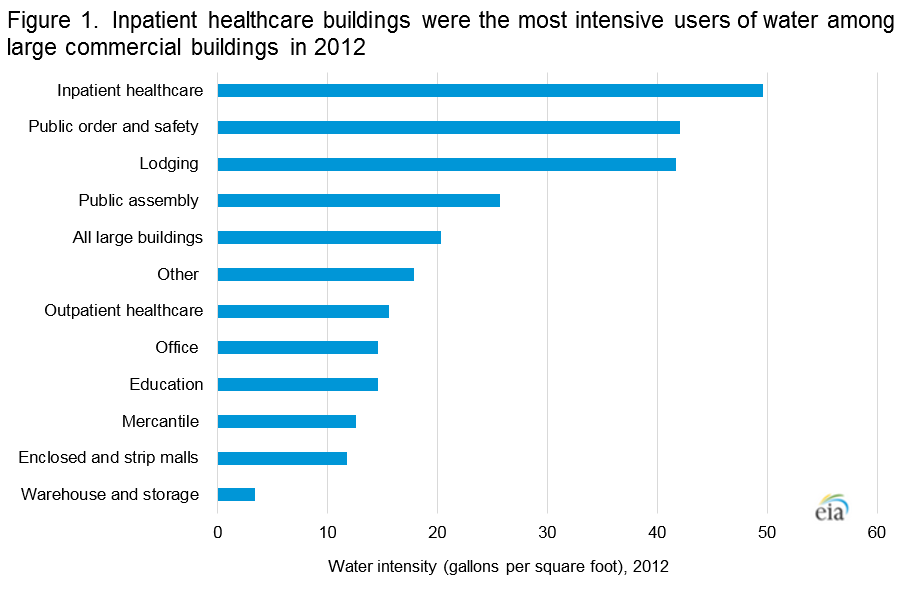
The types of buildings that are the most intensive water users are open around the clock and have activities within them that use large amounts of water. Inpatient healthcare buildings were the most intensive users of water in 2012, averaging almost 50 gallons per square foot per year. Public order and safety buildings (which include prisons) and lodging buildings (which includes hotels) were the next most intensive, each averaging about 42 gallons per square foot. Warehouse and storage buildings used only 3.4 gallons per square foot, making them the least water intensive of the large buildings.
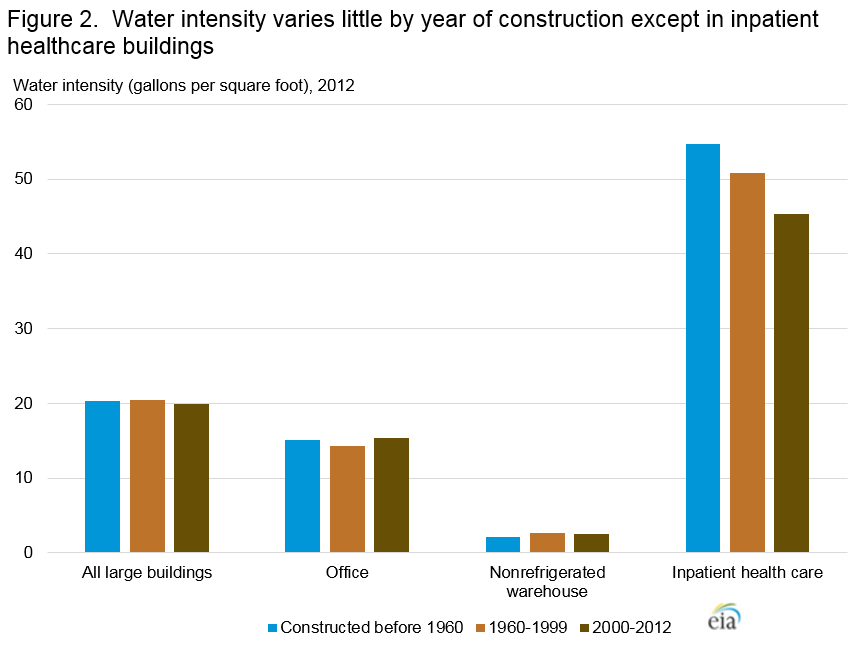
Water use per square foot in large buildings does not vary significantly by the age of the building, with the exception of inpatient healthcare buildings. Large buildings constructed before 1960, between 1960 and 1999, and between 2000 and 2012 all used about 20 gallons per square foot in 2012. Within building types, such as office and nonrefrigerated warehouse, the usage per square foot is about the same for the different age groups evaluated. However, newer inpatient healthcare buildings used less water per square foot than older buildings. Inpatient healthcare buildings constructed before 1960 used 55 gallons per square foot compared to 45 gallons per square in buildings constructed in 2000 or later, a statistically significant difference.
Some building types use water disproportionately compared to their share of the total number of large buildings and their total floorspace. Although inpatient healthcare buildings made up only 11% of the large commercial building floorspace and 7% of the total number of large buildings, they accounted for 26% of the total water consumption in large commercial buildings in 2012. Lodging buildings made up 9% of both the floorspace and the total number of large buildings, but they consumed 19% of the total water in large buildings. These two building types combined accounted for almost half of the total large commercial building water consumption in 2012, while making up only about 20% of the total floorspace and total number of buildings.

2012 CBECS Large Buildings Water Usage Data
A summary of the data is provided in two detailed tables:
- Table W1. Water consumption in large commercial buildings
- Table WD1. Daily water consumption in large commercial buildings
A 2012 CBECS public use microdata file on large buildings water usage is available that contains untabulated records about individual buildings. This file is published so that data users can create custom tables that are not available in this report.
The microdata file contains 1,129 records. They represent commercial buildings larger than 200,000 square feet in the 50 states and the District of Columbia. Each record corresponds to a single responding, in-scope, sampled building. The large buildings sample represents an estimated 46,000 total buildings in the United States.
Data are available in two formats: a CSV (comma delimited) file and a SAS data file. The variable and response codebook contains the variable length, type, labels, and descriptions of the response codes for each variable. The SAS format codes can be used to assign formats to variables in SAS.
| File name | Format | Release date |
|---|---|---|
| User's Guide to the 2012 CBECS Large Buildings Water Usage Public Use Files | February 2017 | |
| 2012 CBECS large buildings water usage microdata | SAS | February 2017 |
| 2012 CBECS large buildings water usage microdata | CSV | February 2017 |
| Variable and response codebook | XLS | February 2017 |
| SAS format codes | SAS | May 2016 |
| Example using public use data: Table W1 | XLS | February 2017 |
Footnotes
Specific questions on this product may be directed to Consumption and efficiency data.


