Older than 3150 days
Capital investment in upstream oil and natural gas industries
Feb 15, 2018
The International Energy Outlook 2017 anticipates a large increase in oil and natural gas production with many large, capital-intensive projects that will come online after 2025 to meet rising demand. This Issues in Focus paper discusses recent trends in the upstream oil and natural gas markets; explains how these trends are reflected in IEO2017; and covers some of the uncertainties surrounding the projections.
Wholesale Electricity and Natural Gas Market Data
Feb 15, 2018
This site contains spreadsheets with wholesale electricity and natural gas data from eight major trading hubs that cover most regions of the United States. The data are through February 13, 2018, and are republished, with permission, from the Intercontinental Exchange (ICE).
State Energy Profiles: New monthly data for November and December 2017, new annual data, and updated Profile Analyses and Quick Facts
Feb 15, 2018
New monthly data are available for electricity, petroleum, natural gas, and coal series. New annual data are available for average temperature, precipitation, and vehicle miles traveled. In addition, Profile Analyses and Quick Facts have been updated for Arkansas, Louisiana, Nebraska, North Dakota, and South Dakota.
U.S. Crude Oil and Natural Gas Proved Reserves, Year-end 2016
Feb 13, 2018
The United States had 341.1 trillion cubic feet (Tcf) of natural gas proved reserves as of December 31, 2016, an increase of 5% from 2015, according to U.S. Crude Oil and Natural Gas Proved Reserves, Year-end 2016, released today by the U.S. Energy Information Administration (EIA). U.S. crude oil and lease condensate proved reserves remained at 35.2 billion barrels at year-end 2016 (a slight net decline of 17 million barrels).
Quarterly Coal Distribution Report (QCDR) – Third Quarter 2017
Feb 12, 2018
The Quarterly Coal Distribution Report (QCDR) provides detailed U.S. domestic coal distribution data for July – Sept 2017, excluding waste coal and imports, by coal origin, coal destination, mode of transportation, and consuming sector. Quarterly coal distribution data for all years are preliminary and will be superseded by the release of the corresponding “Annual Coal Distribution Report.”
Quarterly Coal Report (QCR), July – September 2017
Feb 12, 2018
U.S. coal production during third quarter 2017 totaled 196.2 million short tons. This was 4.9% higher than the previous quarter and 0.5% lower than third quarter 2016. Third quarter 2017 U.S. coal exports (24.6 million short tons) increased 13.1% from second quarter 2017 and increased 96.3% from third quarter 2016. U.S. coal imports in third quarter 2017 totaled 2.3 million short tons. All data for 2016 and prior years are final. All data for 2017 are preliminary.
Drilling Productivity Report
Feb 12, 2018
The Drilling Productivity Report (DPR) uses recent data on the total number of drilling rigs in operation along with estimates of drilling productivity and estimated changes in production from existing oil and natural gas wells to provide estimated changes in oil and natural gas production for seven key regions.
State Energy Data System: Nuclear energy for 2016
Feb 9, 2018
Annual state-level estimates of nuclear energy consumption, prices, and expenditures.
Domestic Uranium Production Report - Quarterly
Feb 8, 2018
Fourth quarter 2017 update of uranium production in the United States and operating status of U.S. uranium mills and plants.
Short-Term Energy Outlook
Feb 6, 2018
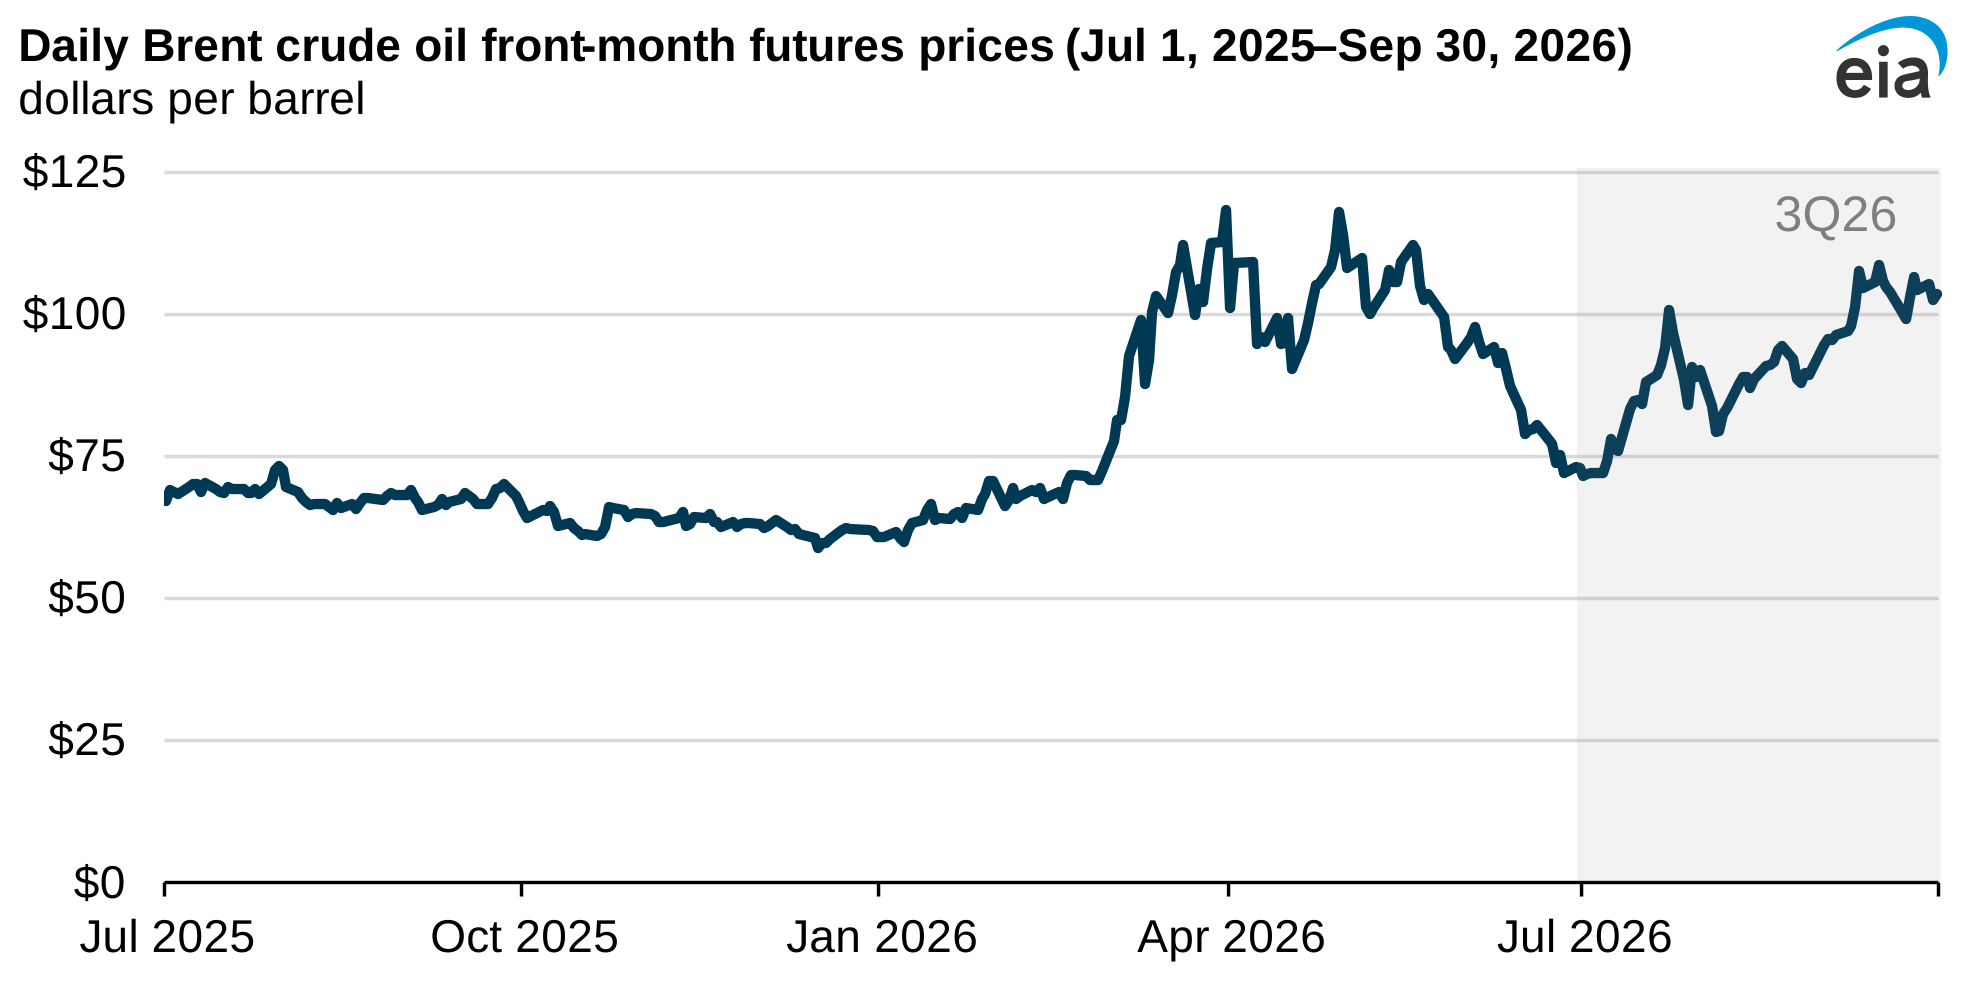
North Sea Brent crude oil spot prices averaged $69 per barrel (b) in January, an increase of $5/b from the December level. Monthly average Brent prices have increased for seven consecutive months, and, on January 11, spot prices moved higher than $70/b for the first time since December 2014. EIA forecasts Brent spot prices will average about $62/b in both 2018 and 2019 compared with an average of $54/b in 2017.
Annual Energy Outlook 2018
Feb 6, 2018
EIA's Annual Energy Outlook provides modeled projections of domestic energy markets through 2050.
State Energy Data System: Motor gasoline, fuel ethanol, and aviation gasoline for 2016
Feb 2, 2018
Annual state-level estimates of motor gasoline and aviation gasoline consumption, prices, and expenditures and fuel ethanol consumption for 2016.
Petroleum Marketing Monthly
Feb 1, 2018
The February 2018 Petroleum Marketing Monthly (PMM), with data through November 2017, presents monthly and annual price and volume statistics covering crude oil and refined products sales in the United States.
Natural Gas Monthly
Jan 31, 2018
In November 2017, for the sixth consecutive month, dry natural gas production increased year-to-year from the same month a year ago. The preliminary level for dry natural gas production in November 2017 was 2,321 billion cubic feet (Bcf), or 77.4 Bcf/day. This level was 5.3 Bcf/day (7.4%) higher than the November 2016 level of 72.1 Bcf/day. The average daily rate of dry natural gas production for November was the highest for any month since EIA began tracking monthly dry production in 1973.
Petroleum Supply Monthly
Jan 31, 2018
Supply and disposition of crude oil and petroleum products on a national and regional level. The data series describe production, imports and exports, movements, and inventories.
Company Level Imports
Jan 31, 2018
Imports data at the company level collected from the EIA-814 Monthly Imports Report.
U.S. Movements of Crude Oil By Rail
Jan 31, 2018
Monthly data on rail movements of crude oil have been updated for November 2017. Crude oil movements by rail have significantly increased over the past five years. The data on crude-by-rail (CBR) movements are also fully integrated with EIA’s existing monthly petroleum supply statistics, which already include crude oil movements by pipeline, tanker, and barge.
Monthly Biodiesel Production Report
Jan 31, 2018
Monthly national and regional biodiesel production data for November 2017. In addition to biodiesel production, data included producer sales, producer stocks, and feedstock inputs.
Monthly Crude Oil and Natural Gas Production
Jan 31, 2018
These monthly production estimates are based on data from the EIA-914, Monthly Crude Oil, Lease Condensate, and Natural Gas Production Report.
Monthly Energy Review
Jan 26, 2018
EIA's comprehensive report on recent integrated energy statistics. Preliminary estimates indicate that in October 2017, U.S. residential energy consumption totaled 1.4 quadrillion Btu, a 4% increase from October 2016.
State Energy Data System: Retail electricity for 2016
Jan 26, 2018
Annual state-level estimates of retail electricity consumption, prices, and expenditures.
State Electricity Profiles updated with 2016 data
Jan 25, 2018
Contains data tables describing the electricity industry in each state. Data include generating capability, electricity generation, fuel use and prices, retail sales, emissions, net interstate transfers of electricity, and metering counts.
Electric Power Monthly
Jan 24, 2018
Data in the January 2018 Electric Power Monthly (EPM) are for November 2017, during which net generation in the United States rose 3.3 percent from the November 2016 level. Consumption of natural gas for power generation was up 0.9 percent compared to November 2016. The average residential retail price of electricity for November 2017 was up 2.0 percent from what it had been in November 2016.
Electricity Monthly Update
Jan 24, 2018
This issue contains data for November 2017 as well as a feature article on how utility-scale electric batteries differ widely on their discharge duration
Prime Supplier Report
Jan 23, 2018
The latest Prime Supplier Report presents data through November 2017 on Form EIA-782C, "Monthly Report of Prime Supplier Sales of Petroleum Products Sold for Local Consumption." These data measure primary petroleum product deliveries into the states where they are locally marketed and consumed.
Energy-Related Carbon Dioxide Emissions by State, 2000-2015
Jan 22, 2018
Energy-related carbon dioxide (CO2) emissions vary significantly across states, whether considered on an absolute basis or on a per capita basis. Total state CO2 emissions include those from direct fuel use across all sectors, including residential, commercial, industrial, and transportation, as well as primary fuels consumed for electricity generation.