Older than 3180 days
Drilling Productivity Report
Jan 16, 2018
The Drilling Productivity Report (DPR) uses recent data on the total number of drilling rigs in operation along with estimates of drilling productivity and estimated changes in production from existing oil and natural gas wells to provide estimated changes in oil and natural gas production for seven key regions.
Monthly Solar Photovoltaic Module Shipments Report
Jan 10, 2018
This report contains monthly summary data for the photovoltaic industry in the United States. Data include manufacturing, imports, and exports of modules in the United States and its territories. Summary data include volumes in peak kilowatts and average prices. Where possible, imports and exports are listed by country, and shipments to the United States are listed by state.
Short-Term Energy Outlook
Jan 9, 2018
This edition of the Short-Term Energy Outlook is the first to include forecasts for 2019.
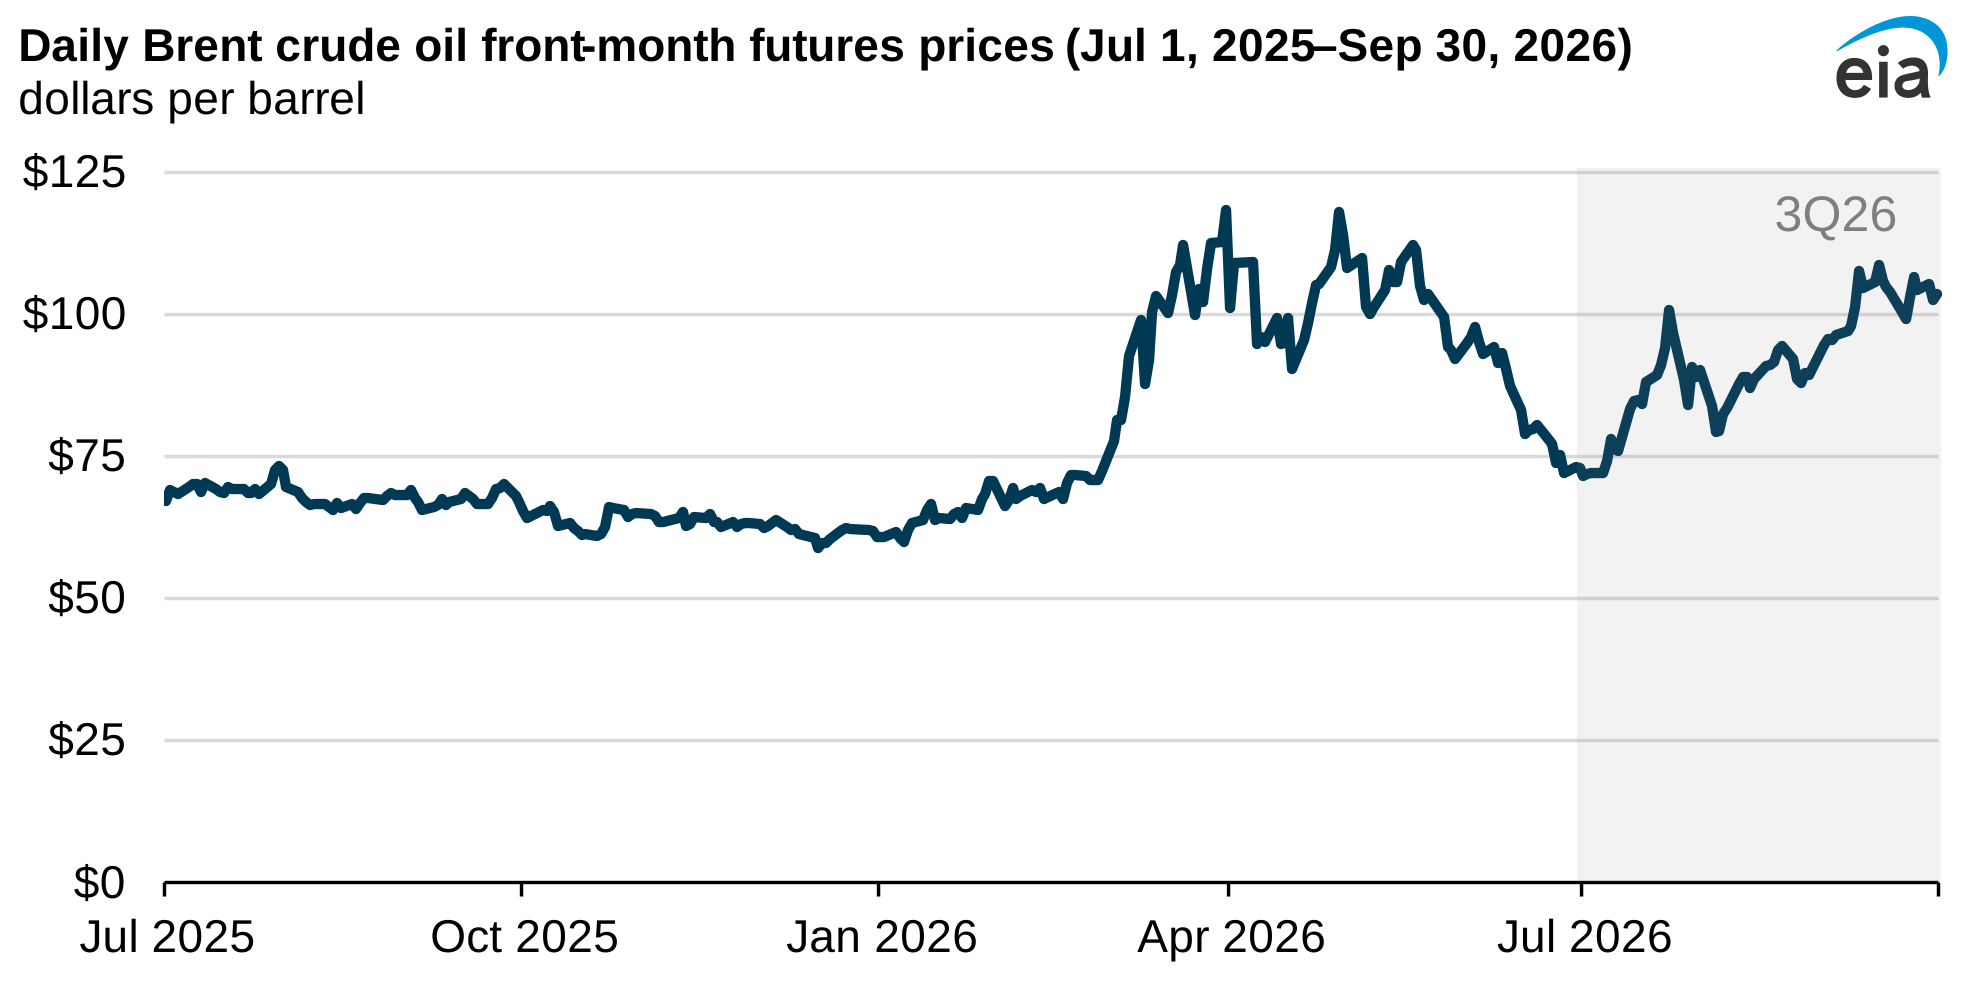
Benchmark North Sea Brent crude oil spot prices averaged $64 per barrel (b) in December, an almost $2/b increase from the November average and the highest monthly average since November 2014.
State Energy Data System: Distillate fuel oil, residual fuel oil, and kerosene for 2016
Jan 5, 2018
Annual state-level estimates of consumption, prices, and expenditures for distillate fuel oil, residual fuel oil, and kerosene for 2016.
Northeastern Winter Energy Alert
Jan 5, 2018
Sustained cold weather and high natural gas consumption pushing up spot natural gas and electricity prices.
Petroleum Marketing Monthly
Jan 2, 2018
The January 2018 Petroleum Marketing Monthly (PMM), with data through October 2017, presents monthly and annual price and volume statistics covering crude oil and refined products sales in the United States.
Natural Gas Monthly
Dec 29, 2017
In October 2017, for the fifth consecutive month, dry natural gas production increased year-to-year from the same month a year ago. The preliminary level for dry natural gas production in October 2017 was 2,329 billion cubic feet (Bcf), or 75.1 Bcf/day. This level was 3.7 Bcf/day (5.2%) higher than the October 2016 level of 71.4 Bcf/day. Dry natural gas production for October was the highest for the month since EIA began tracking monthly dry production in 1973.
Petroleum Supply Monthly
Dec 29, 2017
Supply and disposition of crude oil and petroleum products on a national and regional level. The data series describe production, imports and exports, movements, and inventories.
Company Level Imports
Dec 29, 2017
Imports data at the company level collected from the EIA-814 Monthly Imports Report.
Monthly Biodiesel Production Report
Dec 29, 2017
Monthly national and regional biodiesel production data for October 2017. In addition to biodiesel production, data included producer sales, producer stocks, and feedstock inputs.
U.S. Movements of Crude Oil By Rail
Dec 29, 2017
Monthly data on rail movements of crude oil have been updated for October 2017. Crude oil movements by rail have significantly increased over the past five years. The data on crude-by-rail (CBR) movements are also fully integrated with EIA’s existing monthly petroleum supply statistics, which already include crude oil movements by pipeline, tanker, and barge.
Monthly Crude Oil and Natural Gas Production
Dec 29, 2017
These monthly production estimates are based on data from the EIA-914, Monthly Crude Oil, Lease Condensate, and Natural Gas Production Report.
Monthly Energy Review
Dec 22, 2017
EIA's comprehensive report on recent integrated energy statistics. Preliminary data indicate that, in September 2017, U.S. total primary energy consumption equaled 7.6 quadrillion Btu, a 1% decrease from September 2016. The electric power sector accounted for 41% of the total, the transportation sector for 30%, the industrial sector for 23%, and the residential and commercial sectors for 3% each.
Prime Supplier Report
Dec 21, 2017
The latest Prime Supplier Report presents data through October 2017 on Form EIA-782C, "Monthly Report of Prime Supplier Sales of Petroleum Products Sold for Local Consumption." These data measure primary petroleum product deliveries into the states where they are locally marketed and consumed.
New Wolfcamp formation maps
Dec 21, 2017
EIA published new structure and thickness maps for the Wolfcamp formation, one of the main oil producing reservoirs of the Permian basin, as well as and an updated map of the major structural and tectonic features of the Permian basin region (see “Permian Basin” section). Shapefiles for these maps are also available at the bottom of the linked page.