
U.S. gasoline prices ahead of Memorial Day weekend are 1% higher than last year
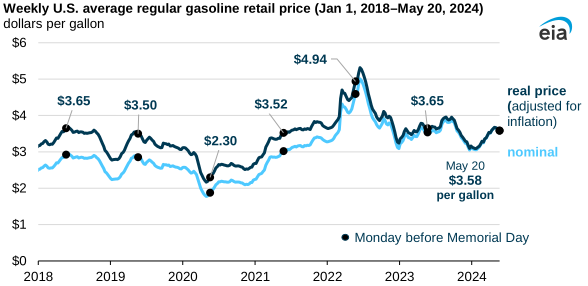
Note: Real prices are adjusted to May 2024 dollars.
On May 20, 2024, the Monday before Memorial Day, the retail price of regular gasoline averaged $3.58 per gallon (gal) across the United States, 1% higher than at the same time last year. After adjusting for inflation (real terms), average U.S. retail gasoline prices going into Memorial Day weekend are 2% lower than last year. The American Automobile Association (AAA) projects 38.4 million people will travel by car over Memorial Day weekend, an increase of 4% compared with last year and nearly 2% more than in 2019.
Gasoline prices have been rising since the start of the year because of increasing crude oil prices, refinery outages and routine maintenance that took place earlier than normal, and the seasonal switch to more expensive summer-grade gasoline.
Crude oil is the main component of retail gasoline prices; it made up 56% of the cost to produce a gallon of gasoline in March 2024. The Brent crude oil price increased 20% from $76 per barrel (b) on January 2 to its most recent peak of $91/b on April 5. Tensions in the Middle East, including Houthi attacks on ships transiting the Red Sea and military actions between Israel and Iran, increased crude oil prices due to the risk of crude oil supply disruptions in the region. In addition, voluntary OPEC+ production cuts have reduced global oil inventories, putting upward pressure on crude oil prices.
Over the past five weeks, Middle East tensions have eased somewhat, and refinery activity has increased, contributing to a 2% drop in average retail gasoline prices. However, events in the Middle East have the potential to quickly change market conditions and add uncertainty to our gasoline price outlook.
U.S. gasoline prices vary regionally, reflecting local supply and demand conditions, state fuel specifications, and state taxes. Retail gasoline prices are usually the highest on the West Coast because of:
- The region’s limited connections with other major refining centers
- Tight local supply and demand conditions
- Higher-than-average state taxes in several states
- Gasoline specifications for California that make gasoline more costly to manufacture
On May 20, West Coast prices averaged $4.62/gal, down 1% in real terms from this time last year.
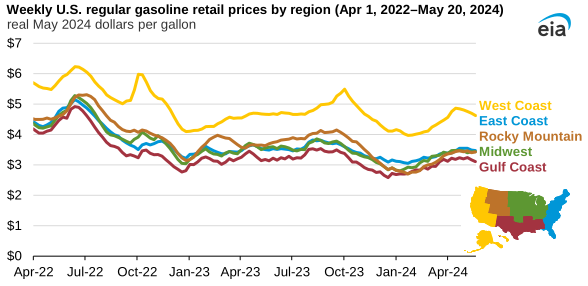
Gasoline prices on the Gulf Coast are usually the lowest of any U.S. region. Gulf Coast states are home to more than half of U.S. refining capacity, and more gasoline is produced than is consumed in the region. Gulf Coast states also have lower gasoline taxes than the national average. Gulf Coast prices on May 20 averaged $3.11/gal, down 1% from this time last year.
On the East Coast, which has the most gasoline demand of the five regions, retail gasoline prices averaged $3.48/gal, down less than 1% from 2023.
Prices are down in the Midwest and the Rocky Mountains compared with last year. Midwest prices averaged $3.43/gal, down 4% from the previous year, and Rocky Mountains prices averaged $3.43/gal, down 7% from 2023 after adjusting for inflation.
Principal contributor: Alexander de Keyserling
Tags: prices, gasoline, crude oil, oil/petroleum