
Europe was the main destination for U.S. LNG exports in 2022
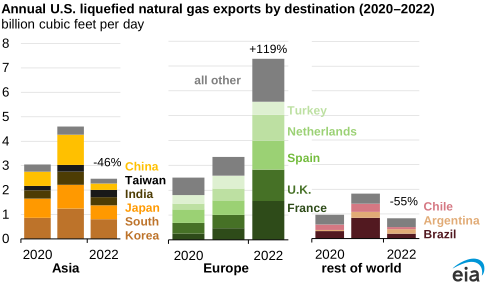
U.S. exports of liquefied natural gas (LNG) averaged 10.6 billion cubic feet per day (Bcf/d) in 2022, increasing by 9% (0.8 Bcf/d) compared with 2021, according to our Natural Gas Monthly. The increase in U.S. LNG exports was driven by strong LNG demand in Europe, high international natural gas prices, and expanded U.S. liquefaction capacity. U.S. LNG exports to Europe increased 141%, or 4.0 Bcf/d, compared with 2021.
U.S. LNG exports to Europe (the European Union [EU-27] plus the United Kingdom) increased as a result of both natural gas supply challenges in Europe after Russia's pipeline exports to the region declined to 40-year lows and higher prices at Europe’s natural gas trading hubs relative to other LNG markets.
Europe became the primary destination for U.S. LNG exports in 2022, accounting for 64% (6.8 Bcf/d) of total exports. Four countries—France, the U.K., Spain, and the Netherlands—accounted for a combined 74% (5.0 Bcf/d) of U.S. LNG exports to Europe.
In 2022, Europe increased LNG imports to an all-time high of 14.9 Bcf/d (annual average), 65% (5.9 Bcf/d) more than in the previous year, according to data from Cedigaz. Similar to 2021, three countries—the United States, Qatar, and Russia—provided 73% (10.8 Bcf/d) of Europe’s LNG imports in 2022. Excluding intra-regional trade, the remaining 3.8 Bcf/d of LNG imports was supplied by 14 other LNG-exporting countries. Europe’s LNG import capacity expanded in 2022, and we expect it to grow by one-third by the end of 2024, as countries add new LNG regasification facilities and expand existing import terminals.
U.S. LNG exports to Asia declined by 46% (2.1 Bcf/d) and averaged 2.5 Bcf/d in 2022. Most countries in Asia reduced LNG imports from the United States last year compared with 2021. The most notable reduction was in U.S. LNG exports to China, which decreased by 78% (1.0 Bcf/d). China’s annual LNG imports from all countries declined 20% (2.1 Bcf/d) in 2022 compared with 2021 and averaged 8.4 Bcf/d—the lowest level since 2019, according to data from China’s General Administration of Customs.
U.S. LNG exports to eight countries in Latin America declined by 62% (1.1 Bcf/d) in 2022. The largest decline was in exports to Brazil—by 77% (0.6 Bcf/d)—as increased availability of hydroelectric power reduced natural gas demand for electricity generation at Brazil’s natural gas-fired power plants. In 2022, Kuwait was the only country in the Middle East that imported U.S. LNG, with exports averaging 0.2 Bcf/d, or twice 2021 levels.
Principal contributor: Victoria Zaretskaya