The United States exported more natural gas than it imported in 2017
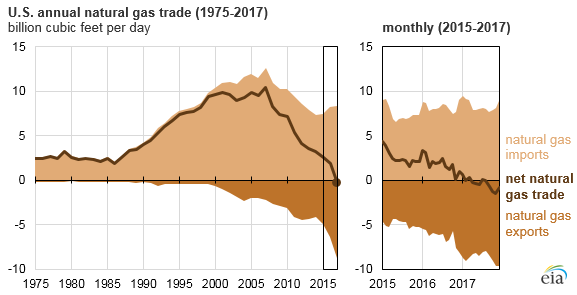
The United States exported more natural gas than it imported in 2017, marking the first time since 1957 that the United States has been a net natural gas exporter. The transition to net exporter occurred as natural gas production in the United States continued to grow, reducing pipeline imports from Canada and increasing exports, both by pipeline and as liquefied natural gas (LNG).
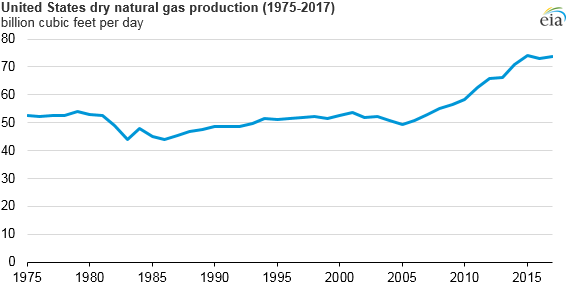
Natural gas production in the United States increased significantly over the past decade. The United States surpassed Russia in 2009 as the world’s largest natural gas producer as shale gas production drove overall increases in natural gas production. Most recently, production increases have been concentrated in the Appalachia region—primarily the Marcellus and Utica shales. Natural gas production reached an average of 73.6 billion cubic feet per day (Bcf/d) in 2017, a 1% increase from the 2016 level and just slightly lower than the 2015 record level.
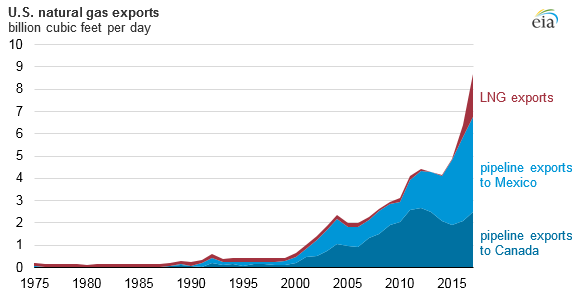
As the United States has produced more natural gas, particularly from the Appalachia region, pipeline imports from Canada have decreased. As new pipeline capacity comes online in the region, more natural gas can be delivered to regions in the Midwest and Northeast, displacing Canadian imports and increasing U.S. pipeline exports to Canada.
U.S. natural gas pipeline capacity into Mexico has also increased over the past few years, driven by growth in demand for natural gas from Mexico’s power sector and favorable prices compared with natural gas supplied by LNG shipments. U.S.-Mexico natural gas pipeline capacity is currently 11.2 Bcf/d, with another 3.2 Bcf/d of capacity scheduled to be added later in 2018. Pipeline exports to Mexico have grown along with pipeline capacity, more than doubling since 2014 and averaging 4.2 Bcf/d in 2017.
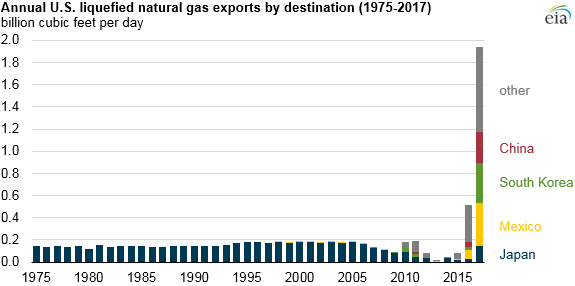
U.S. LNG exports increased dramatically over the past two years as new liquefaction capacity has come online. The only liquefaction terminal previously operating in the United States—the Kenai LNG terminal in Alaska—ceased operations in 2015. In 2016, as the Sabine Pass LNG terminal in Louisiana began to ramp up operations, U.S. LNG exports increased. Sabine Pass now has four operating liquefaction units, with a fifth currently under construction.
The Cove Point LNG facility in Maryland exported its first LNG cargo on March 1, 2018. Cove Point is the second currently operating LNG export facility in the United States, after Sabine Pass. Four other LNG projects are under construction and expected to increase U.S. liquefaction capacity from 3.6 Bcf/d to 9.6 Bcf/d by the end of 2019, further increasing U.S. natural gas exports.
EIA’s Short-Term Energy Outlook projects that the United States will be a net exporter of natural gas in each month remaining in 2018 and each month of 2019 as pipeline exports to Mexico continue to grow along with LNG export capacity.
Principal contributor: Michael Mobilia