Appalachia region drives growth in U.S. natural gas production since 2012
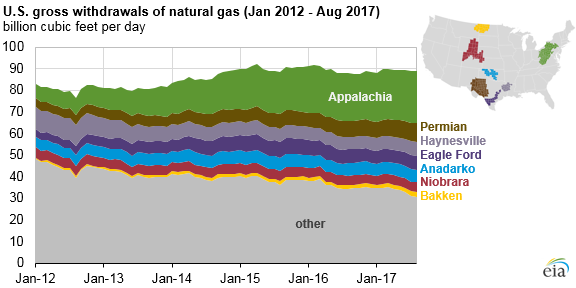
Shale gas production in the Appalachia region has increased rapidly since 2012, driving an overall increase in U.S. natural gas production. According to EIA’s Drilling Productivity Report, natural gas production in the Appalachia region—namely the Marcellus and Utica shale plays—has increased by more than 14 billion cubic feet per day (Bcf/d) since 2012. Overall Appalachian natural gas production grew from 7.8 Bcf/d in 2012 to 22.1 Bcf/d in 2016 and was 23.8 Bcf/d in 2017, based on EIA data through October 2017.
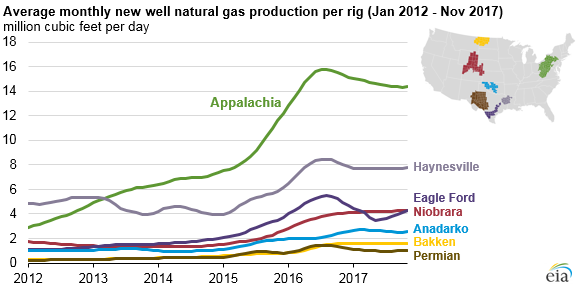
Drilling wells in the Appalachia region has become very productive. The average monthly natural gas production per rig for new wells in the Appalachia region increased by 10.8 million cubic feet per day since January 2012. EIA attributes this increase to efficiency improvements in horizontal drilling and hydraulic fracturing in the region, which include faster drilling, longer laterals, advancements in technology, and better targeting of wells.
For example, in West Virginia, the average lateral length per well has increased from about 2,500 feet in 2007 to more than 7,000 feet in 2016. Some operators have recorded lateral lengths as long as 15,000 feet in the Marcellus and 19,000 feet in the Utica. Along with longer horizontal drilling, the days it takes for completion have decreased from about 30 days in 2011 to 7 days in 2015.
Source: U.S. Energy Information Administration, based on DrillingInfo, Inc., Appalachian Oil and Natural Gas Research Consortium, and U.S. Geological Survey
Source: U.S. Energy Information Administration, based on DrillingInfo, Inc., Appalachian Oil and Natural Gas Research Consortium, and U.S. Geological Survey
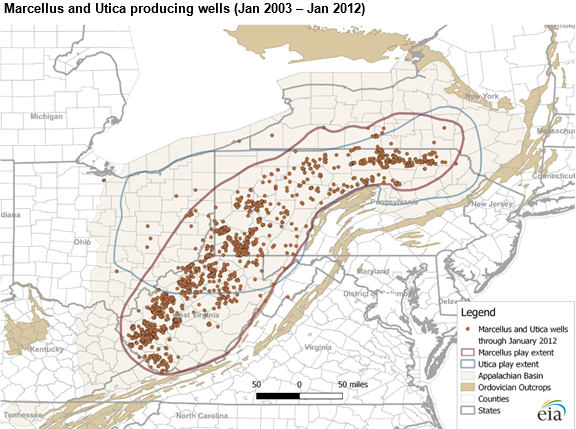
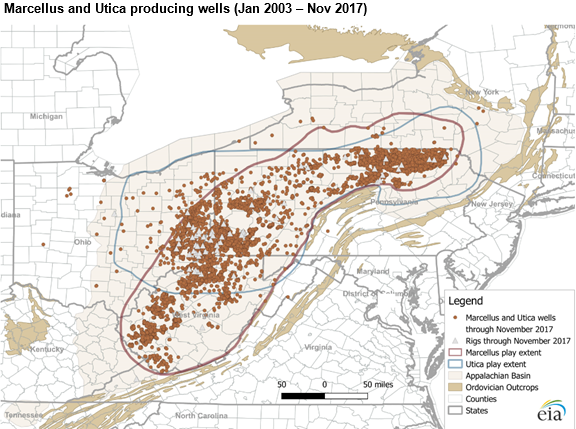
The Marcellus shale extends from New York in the north to Kentucky and Tennessee in the south and is the most productive natural gas-producing formation in the Appalachian Basin. The formation's footprint covers about 95,000 square miles. Dry natural gas wells in the Marcellus are mostly located in the eastern portion of the play, and liquids-rich wells are typically located in the western portion.
The Utica Play consists of two stacked geological units: the Utica and Point Pleasant formations. These formations are older—and therefore deeper—than the Marcellus formation. The Utica play spans about 60,000 square miles across Ohio, West Virginia, Pennsylvania, and New York.
Drilling in the Marcellus Shale began in 2003 in Pennsylvania and was followed by drilling in West Virginia. In 2010 drilling began in the deeper Utica and Point Pleasant formations in Ohio and has more recently started in Pennsylvania and West Virginia. As of November 2017, more than 1,800 wells have been drilled in the Utica-Point Pleasant, and more than 11,300 wells have been drilled in the Marcellus.
Principal contributors: Emily Geary, Olga Popova
Tags: map, Marcellus, natural gas, Ohio, Pennsylvania, production/supply, states, Utica, West Virginia