Natural gas production in Pennsylvania, Ohio, West Virginia growing faster than demand
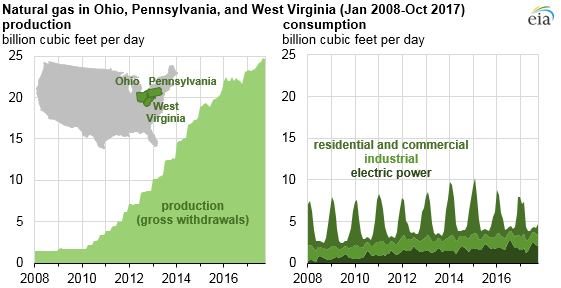
Significant growth in natural gas production over the past decade—primarily from the Marcellus and Utica shales in the Appalachian Basin—have increased gross natural gas output in Ohio, Pennsylvania, and West Virginia. Production in these three states increased from a combined 1.4 billion cubic feet per day (Bcf/d) in 2008 to nearly 24 Bcf/d in 2017, with their combined share of total U.S. natural gas production reaching 27%, up from just 2% in 2008, based on data through October 2017. Over that same period, natural gas consumption in these three states has also grown but to a much lesser extent.
Almost all of the recent growth in natural gas consumption in these states has been in the electric power sector. Natural gas consumption for electricity generation in these states grew from 0.5 Bcf/d in 2008 to 1.9 Bcf/d in 2017, based on data through October. Additions of natural gas-fired electricity generating capacity, higher utilization of existing natural gas-fired plants, and retirements of coal plants have contributed to greater use of natural gas for electricity generation in the region.
Prior to 2011, natural gas production in these states was lower than demand, and interstate pipelines moved natural gas into the area primarily from production areas in the Gulf Coast. In recent years, however, increased supply has been able to meet demand within these states and in neighboring states. Existing pipelines have been modified to transport natural gas out of, instead of into, Appalachia, and new pipelines have been announced to link Appalachian supply to downstream markets.
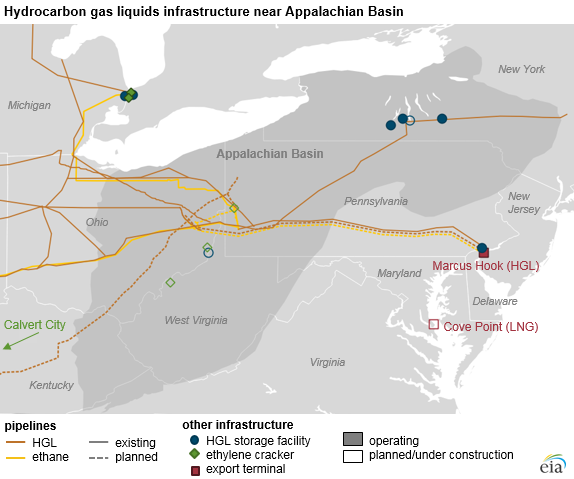
Overall, Appalachian production has been displacing Gulf Coast supply, freeing additional U.S. production for export by pipelines and as liquefied natural gas (LNG). Direct pipeline interconnections are planned for Appalachian natural gas to reach Dominion Energy’s Cove Point LNG Terminal, which is undergoing commissioning on the Maryland coastline. Cove Point is designed to process an average of 0.75 Bcf/d of liquefied natural gas for export and expects to commence service in early 2018.
The petrochemical industry is another growing consumer of natural gas in the region. Marcellus and Utica natural gas is rich in liquids, including ethane, making the region attractive for chemical manufacturers. Ethylene crackers, for example, convert hydrocarbon feedstocks such as ethane to olefins, the building blocks for plastics and resins. The only operating ethylene cracker in Appalachia, located in Calvert City, Kentucky, consumes an estimated 20,000 barrels per day (b/d) of ethane.
Three new ethylene crackers have been proposed for the region, one each in Pennsylvania, Ohio, and West Virginia. The Shell Chemicals facility, currently under construction in Monaca, Pennsylvania, is planned to consume 90,000 b/d to 100,000 b/d of ethane when completed in the early part of the next decade.
Given recent growth in hydrocarbon gas liquid (HGL) production, pipeline capacity to transport ethane and other HGL within and out of Appalachia has been increasing since 2013. Pipelines originating in the region can ship ethane to the Gulf Coast, Canada, and overseas markets from export terminals in Pennsylvania and Texas.
The first U.S. ethane exports shipped in March 2016 from Sunoco Logistics’ export terminal in Marcus Hook, Pennsylvania, which has the capacity to export 35,000 b/d of ethane and store approximately 5 million barrels of HGL.
Principal contributors: Stacy Angel, Warren Wilczewski