Ohio and Pennsylvania increased natural gas production more than other states in 2016
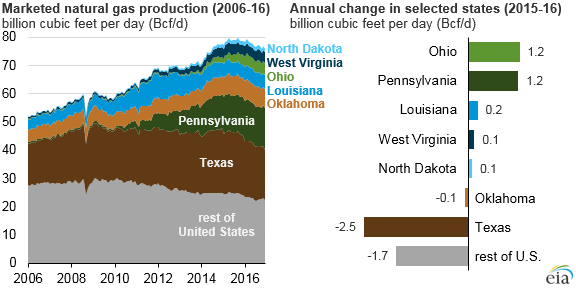
After reaching a record high of 79 billion cubic feet per day (Bcf/d) in 2015, U.S. marketed natural gas production fell to 77 Bcf/d in 2016, the first annual decline since 2005. Texas, the state with the most natural gas production, fell by 2.5 Bcf/d, while Ohio and Pennsylvania each increased by about 1.2 Bcf/d.
EIA measures natural gas production in three different ways. Gross withdrawals are the full volume of compounds extracted at the wellhead, which includes all natural gas plant liquids and nonhydrocarbon gases after oil, lease condensate, and water have been removed. Marketed natural gas production excludes natural gas used for repressuring the well, vented and flared gas, and any nonhydrocarbon gases. Dry natural gas production is marketed production minus natural gas plant liquids.
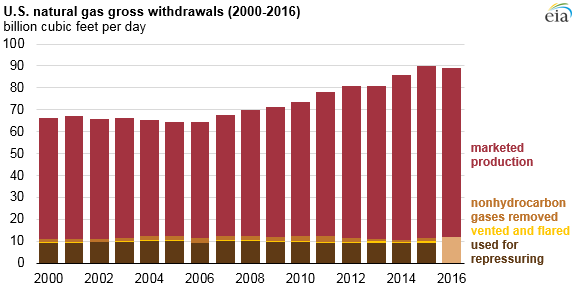
Note: Natural gas production in 2016 beyond the marketed production category is not yet available.
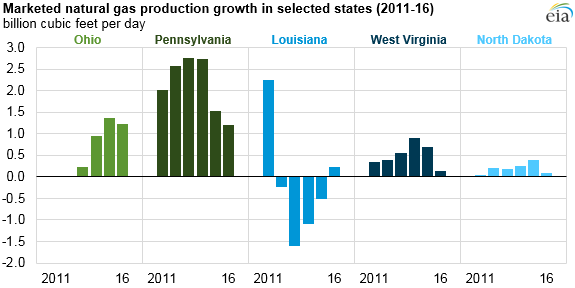
Pennsylvania and Ohio had the two largest annual natural gas production increases from 2015 to 2016, reflecting higher production from the Utica and Marcellus shale plays, which have accounted for 85% of the U.S. shale gas production growth since 2012. Production in Pennsylvania and Ohio has accounted for an increasing share of total U.S. natural gas production in recent years, growing from less than 2% in 2006 to 24% in 2016.
Pennsylvania surpassed Louisiana in 2013 to become the second-highest natural gas producing state, behind Texas. Although both states had higher production in 2016, Ohio surpassed West Virginia last year to become the seventh-highest natural gas-producing state. The increased productivity of natural gas wells in the Marcellus Shale and Utica Shale is a result of ongoing improvements in precision and efficiency of horizontal drilling and hydraulic fracturing occurring in these regions.
Louisiana, West Virginia, and North Dakota also increased their natural gas production in 2016. Louisiana’s increase was the first annual increase since 2011, while West Virginia and North Dakota have had 13 and 8 consecutive years of natural gas production increases, respectively.
EIA's Short-Term Energy Outlook projects that natural gas production will increase in both 2017 and 2018 as natural gas prices rise, resulting in higher rig activity. Spot natural gas prices at the Henry Hub, a natural gas market benchmark, fell from $2.63 per million British thermal units (MMBtu) in 2015 to $2.51/MMBtu in 2016. Henry Hub prices are expected to increase to an annual average of $3.10/MMBtu in 2017 and $3.45/MMBtu in 2018. These price increases reflect the expectation of increased natural gas consumption, increased exports, and lower average inventory levels.
Principal contributors: Owen Comstock, Jeffrey Little
Tags: natural gas, Ohio, Pennsylvania, production/supply, states, Texas