In the News:
U.S. ethane exports rise in 2019 as China receives its first U.S. cargos
U.S. ethane exports rose from 256,000 barrels per day (b/d) in 2018 to 283,000 b/d in 2019 (January through October), with exports to China accounting for 8,000 b/d (29.8%) of this increase. China became a destination for U.S. ethane exports for the first time in June 2019 as the SP Olefins Taixing ethylene plant went online last year.
Ethane is used as a feedstock for petrochemical manufacturing, and the prices of other feedstocks such as propane and naphtha have recently been more than double the price of ethane ($/ton). In 2010, the price of U.S. ethane was similar to other feedstock prices and linked to the price of oil; however, prices diverged around 2012 as production from shale gas and tight oil formations led to increased ethane production.
From 2014 to 2016, the United States only exported ethane via pipeline to Canada. The first U.S. ethane export terminal at Marcus Hook, located near Philadelphia, Pennsylvania, was commissioned in 2016 with an initial export capacity of 35,000 b/d, resulting in exports to four more countries. In 2018 the 200,000 b/d Morgan’s Point terminal, on the Houston Ship Channel in Texas, began exporting ethane from the Gulf Coast.
Demand for ethane in China is expected to continue to grow with the Made in China 2025 initiative, which aims to increase the share of value-added activity in China in the manufacturing and high-tech industries. China’s goals of accelerating intelligent manufacturing and promoting a green transformation of the petrochemical industry will mean that ethane will be the petrochemical feedstock of choice. Coal-based processes will be phased out, and the use of naphtha will decrease.
Low U.S. ethane prices coupled with increased production have led to increased demand for U.S. ethane around the world.
Overview:
(For the week ending Wednesday, January 29, 2019)
- Natural gas spot prices fell at most locations this report week (Wednesday, January 22 to Wednesday, January 29). The Henry Hub spot price rose from $1.89 per million British thermal units (MMBtu) last Wednesday to $1.92/MMBtu yesterday.
- At the New York Mercantile Exchange (Nymex), the February 2020 contract expired yesterday at $1.877/MMBtu, down 3¢/MMBtu from last Wednesday. The March 2020 contract price decreased to $1.865/MMBtu, down 3¢/MMBtu from last Wednesday to yesterday. The price of the 12-month strip averaging March 2020 through February 2021 futures contracts declined 4¢/MMBtu to $2.177/MMBtu.
- The net withdrawal from working gas totaled 201 billion cubic feet (Bcf) for the week ending January 24. Working natural gas stocks total 2,746 Bcf, which is 24% more than the year-ago level and 8% more than the five-year (2015–19) average for this week.
- The natural gas plant liquids composite price at Mont Belvieu, Texas, fell by 14¢/MMBtu, averaging $4.76/MMBtu for the week ending January 29. The prices of natural gasoline, ethane, and propane fell by 5%, 5%, and 11%, respectively. The prices of isobutane and butane rose by 9% and 11%, respectively.
- According to Baker Hughes, for the week ending Tuesday, January 21, the natural gas rig count decreased by 5 to 115. The number of oil-directed rigs rose by 3 to 676. The total rig count decreased by 2, and it now stands at 794.
Prices/Supply/Demand:
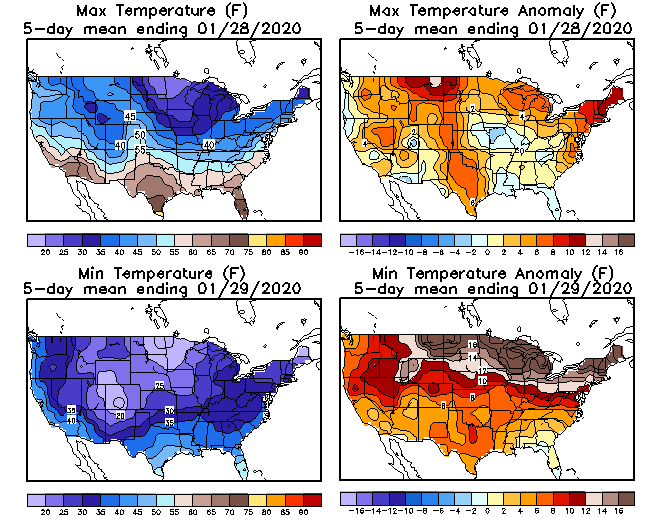
Prices remain low at most locations amid unseasonably warm temperatures. This report week (Wednesday, January 22 to Wednesday, January 29), the Henry Hub spot price traded within a narrow range, rising 3¢ from a low of $1.89/MMBtu last Wednesday to $1.92/MMBtu yesterday. Temperatures were warmer-than-normal across the Lower 48 states, especially across the Northeast and Great Plains. At the Chicago Citygate, the price was unchanged from last Wednesday at $1.80/MMBtu.
California prices are down. The price at PG&E Citygate in Northern California fell 11¢, down from a high of $2.73/MMBtu last Wednesday to $2.62/MMBtu yesterday. The price at SoCal Citygate in Southern California decreased 22¢ from a high of $3.31/MMBtu last Wednesday to $3.09/MMBtu yesterday.
Northeast prices are mixed. At the Transcontinental Pipeline Zone 6 trading point for New York City, the price decreased 8¢ from $2.01/MMBtu last Wednesday to $1.93/MMBtu yesterday. At the Algonquin Citygate, which serves Boston-area consumers, the price went up 8¢ from $2.11/MMBtu last Wednesday to $2.19/MMBtu yesterday after reaching a low of $1.89/MMBtu on Friday.
The Tennessee Zone 4 Marcellus spot price decreased 2¢ from $1.56/MMBtu last Wednesday to $1.54/MMBtu yesterday. The price at Dominion South in southwest Pennsylvania fell 2¢ from $1.54/MMBtu last Wednesday to $1.52/MMBtu yesterday.
Permian Basin prices decline throughout the week. The price at the Waha Hub in West Texas, which is located near Permian Basin production activities, averaged $0.80/MMBtu last Wednesday, $1.09/MMBtu lower than the Henry Hub price. Yesterday, the price at the Waha Hub averaged $0.34/MMBtu, $1.58/MMBtu lower than the Henry Hub price. During the report week, prices reached a low of $0.31/MMBtu on Tuesday.
Supply is down as imports from Canada decline. According to data from IHS Markit, the average total supply of natural gas fell by 1% compared with the previous report week. Dry natural gas production remained constant week over week. Average net imports from Canada decreased 9% from last week because of lower demand for space heating in population centers in the Northeast and Midwest.
Demand falls, driven by residential and commercial sectors. Total U.S. consumption of natural gas fell by 10% compared with the previous report week, according to data from IHS Markit. In the residential and commercial sectors, consumption declined by 15% with the return of unseasonably warm weather. Natural gas consumed for power generation declined by 6% week over week. Industrial sector consumption decreased by 3% week over week. Natural gas exports to Mexico increased 13% as maintenance concluded on the Valley Crossing Pipeline, which delivers natural gas from the Agua Dulce hub in south Texas to the Sur de Texas-Tuxpan pipeline at the United States-Mexico border at Brownsville, Texas.
U.S. LNG exports increase week over week. Twenty-one liquefied natural gas (LNG) vessels (eight from Sabine Pass; four from Freeport; three from Corpus Christi; and two each from Cove Point, Elba Island, and Cameron) with a combined LNG-carrying capacity of 75 Bcf departed the United States between January 23 and January 30, according to shipping data compiled by Bloomberg.
Storage:
The net withdrawal from storage totaled 201 Bcf for the week ending January 24, compared with the five-year (2015–19) average net withdrawal of 143 Bcf and last year's net withdrawal of 171 Bcf during the same week. Working natural gas stocks totaled 2,746 Bcf, which is 193 Bcf more than the five-year average and 524 Bcf more than last year at this time.
According to The Desk survey of natural gas analysts, estimates of the weekly net change to working natural gas stocks ranged from a net withdrawal of 180 Bcf to 225 Bcf, with a median estimate of 202 Bcf.
The average rate of withdrawal from storage is 14% lower than the five-year average so far in the withdrawal season (November through March). If the rate of withdrawal from storage matched the five-year average of 12.8 Bcf/d for the remainder of the withdrawal season, the total inventory would be 1,890 Bcf on March 31, which is 193 Bcf higher than the five-year average of 1,697 Bcf for that time of year.
More storage data and analysis can be found on the Natural Gas Storage Dashboard and the Weekly Natural Gas Storage Report.
See also:


| Spot Prices ($/MMBtu) | Thu, 23-Jan |
Fri, 24-Jan |
Mon, 27-Jan |
Tue, 28-Jan |
Wed, 29-Jan |
|---|---|---|---|---|---|
| Henry Hub |
1.95 |
1.91 |
1.96 |
1.96 |
1.92 |
| New York |
1.83 |
1.83 |
2.02 |
2.01 |
1.93 |
| Chicago |
1.82 |
1.77 |
1.83 |
1.82 |
1.80 |
| Cal. Comp. Avg.* |
2.16 |
2.05 |
2.10 |
2.08 |
2.11 |
| Futures ($/MMBtu) | |||||
| February contract | 1.926 |
1.893 |
1.902 |
1.934 |
1.877 |
| March contract |
1.904 |
1.870 |
1.878 |
1.908 |
1.865 |
| *Avg. of NGI's reported prices for: Malin, PG&E Citygate, and Southern California Border Avg. | |||||
| Source: NGI's Daily Gas Price Index | |||||


| U.S. natural gas supply - Gas Week: (1/23/20 - 1/29/20) | |||
|---|---|---|---|
Average daily values (Bcf/d): |
|||
this week |
last week |
last year |
|
| Marketed production | 107.4 |
107.5 |
99.9 |
| Dry production | 94.4 |
94.6 |
87.9 |
| Net Canada imports | 4.8 |
5.3 |
5.8 |
| LNG pipeline deliveries | 0.2 |
0.5 |
0.3 |
| Total supply | 99.4 |
100.3 |
94.0 |
|
Source: IHS Markit | |||
| U.S. natural gas consumption - Gas Week: (1/23/20 - 1/29/20) | |||
|---|---|---|---|
Average daily values (Bcf/d): |
|||
this week |
last week |
last year |
|
| U.S. consumption | 96.0 |
106.2 |
103.3 |
| Power | 28.5 |
30.3 |
26.8 |
| Industrial | 24.4 |
25.1 |
25.8 |
| Residential/commercial | 43.1 |
50.8 |
50.6 |
| Mexico exports | 5.6 |
4.9 |
5.0 |
| Pipeline fuel use/losses | 7.4 |
7.6 |
7.3 |
| LNG pipeline receipts | 9.2 |
8.2 |
4.1 |
| Total demand | 118.1 |
126.9 |
119.6 |
|
Source: IHS Markit | |||


| Rigs | |||
|---|---|---|---|
Tue, January 21, 2020 |
Change from |
||
last week |
last year |
||
| Oil rigs | 676 |
0.4% |
-21.6% |
| Natural gas rigs | 115 |
-4.2% |
-41.6% |
| Note: Excludes any miscellaneous rigs | |||
| Rig numbers by type | |||
|---|---|---|---|
Tue, January 21, 2020 |
Change from |
||
last week |
last year |
||
| Vertical | 37 |
-14.0% |
-45.6% |
| Horizontal | 710 |
0.1% |
-23.8% |
| Directional | 47 |
6.8% |
-20.3% |
| Source: Baker Hughes Inc. | |||
| Working gas in underground storage | ||||
|---|---|---|---|---|
Stocks billion cubic feet (Bcf) |
||||
| Region | 2020-01-24 |
2020-01-17 |
change |
|
| East | 638 |
696 |
-58 |
|
| Midwest | 761 |
815 |
-54 |
|
| Mountain | 143 |
151 |
-8 |
|
| Pacific | 210 |
220 |
-10 |
|
| South Central | 995 |
1,065 |
-70 |
|
| Total | 2,746 |
2,947 |
-201 |
|
|
Source: Form EIA-912, Weekly Underground Natural Gas Storage Report | ||||
| Working gas in underground storage | |||||
|---|---|---|---|---|---|
Historical comparisons |
|||||
Year ago (1/24/19) |
5-year average (2015-2019) |
||||
| Region | Stocks (Bcf) |
% change |
Stocks (Bcf) |
% change |
|
| East | 533 |
19.7 |
583 |
9.4 |
|
| Midwest | 616 |
23.5 |
687 |
10.8 |
|
| Mountain | 115 |
24.3 |
144 |
-0.7 |
|
| Pacific | 179 |
17.3 |
235 |
-10.6 |
|
| South Central | 778 |
27.9 |
904 |
10.1 |
|
| Total | 2,222 |
23.6 |
2,553 |
7.6 |
|
| Source: Form EIA-912, Weekly Underground Natural Gas Storage Report | |||||
| Temperature – heating & cooling degree days (week ending Jan 23) | ||||||||
|---|---|---|---|---|---|---|---|---|
HDD deviation from: |
CDD deviation from: |
|||||||
| Region | HDD Current |
normal |
last year |
CDD Current |
normal |
last year |
||
| New England | 300 |
25 |
-6 |
0 |
0 |
0 |
||
| Middle Atlantic | 273 |
10 |
-13 |
0 |
0 |
0 |
||
| E N Central | 290 |
-7 |
-16 |
0 |
0 |
0 |
||
| W N Central | 319 |
3 |
-11 |
0 |
0 |
0 |
||
| South Atlantic | 193 |
10 |
10 |
6 |
-2 |
2 |
||
| E S Central | 196 |
8 |
26 |
0 |
-2 |
0 |
||
| W S Central | 115 |
-23 |
4 |
2 |
-2 |
2 |
||
| Mountain | 201 |
-30 |
0 |
0 |
0 |
0 |
||
| Pacific | 114 |
-5 |
11 |
0 |
-1 |
0 |
||
| United States | 222 |
-3 |
-2 |
1 |
-1 |
1 |
||
|
Note: HDD = heating degree day; CDD = cooling degree day Source: National Oceanic and Atmospheric Administration | ||||||||
Average temperature (°F)
7-day mean ending Jan 23, 2020

Source: National Oceanic and Atmospheric Administration
Deviation between average and normal (°F)
7-day mean ending Jan 23, 2020
Source: National Oceanic and Atmospheric Administration
